N - TU Ilmenau
advertisement

Lecture 9, Multirate Signal Processing,
z-Domain Effects
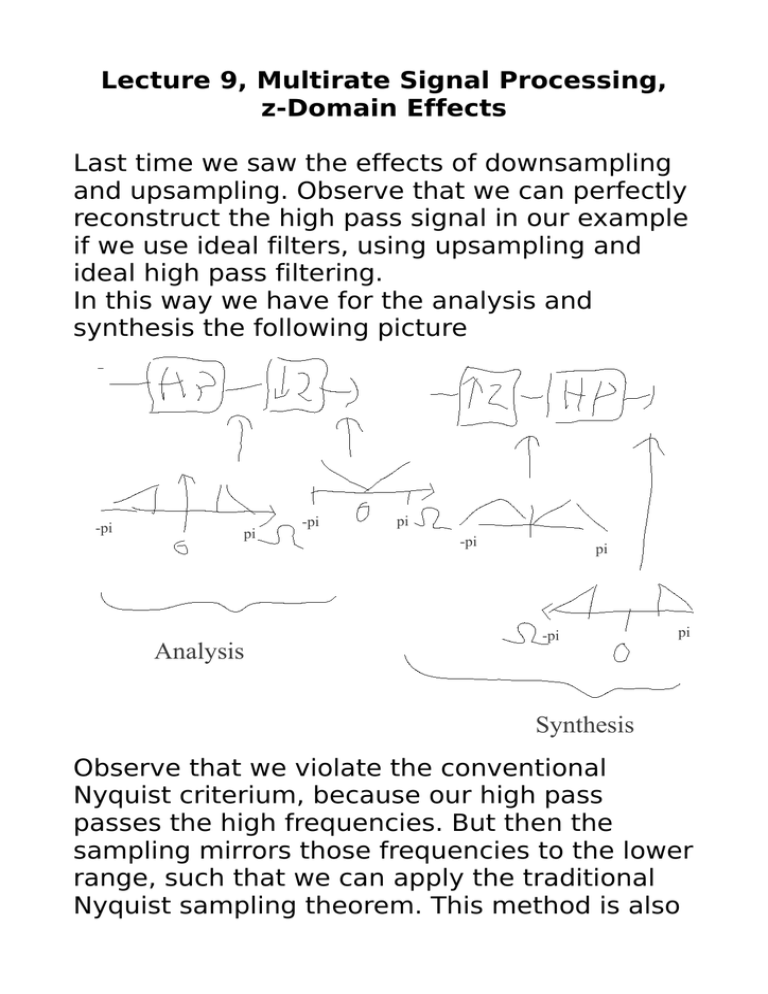
Last time we saw the effects of downsampling
and upsampling. Observe that we can perfectly
reconstruct the high pass signal in our example
if we use ideal filters, using upsampling and
ideal high pass filtering.
In this way we have for the analysis and
synthesis the following picture
-pi
pi
Analysis
-pi
pi
-pi
pi
-pi
pi
Synthesis
Observe that we violate the conventional
Nyquist criterium, because our high pass
passes the high frequencies. But then the
sampling mirrors those frequencies to the lower
range, such that we can apply the traditional
Nyquist sampling theorem. This method is also
known as bandpass Nyquist. This is an
important principle for filter banks and
wavelets. It says that we can perfectly
reconstruct a bandpass signal in a filter bank, if
we sample with twice the rate as the
bandwidth of our bandpass signal (assuming
ideal filters).
Observe that this simple assumption only
works for real valued filters if we have
bandpass filters which start at frequencies
/ N⋅k (integer multiples of / N ) .
Otherwise we could have overlap to the aliased
components!
Example: We have a real valued bandpass filter
which starts its passband at and ends at
/ N (since it is real values the passband
also appears at the same negative frequencies,
− to −− / N ). After multiplication with the
delta train, we get one (out of N) aliasing
component by shifting the negative passband
by 2 / N to the positive frequencies, which
results to the range of / N − to 2 / N − .
Hence we have an overlap from / N − to
/ N and we could not perfectly reconstruct
our signal!
Hence, sampling of twice the bandwidth for real
valued signals only works if the bandwidths are
aligned with / N⋅k . What could we do
otherwise to avoid overlapping aliasing
components? We could simply increas the
sampling rate, for instance to twice the usual
sampling rate (4 times the bandwidth), to have
a "safety margin".
Another possibility would be to shift the
bandpass signals in frequency, such that they
are now aligned with the above mentioned grid.
Observe that this restriction is not needed for
complex signals or filter banks. That is also why
complex filter banks are used for instance in
acoustic echo cancellation, because there the
sampling rate can be increased by a certain
fraction (less than a factor of 2) to reduce
aliasing artifacts, and still have a lower
complexity.
overlap
Summary: if our band boarders are alligned
with multiples of / N then we can
donwsample by N, otherwise we are on the
save side by using N/2 as downsampling rate
for real valued signals. For complex signals we
can always downsample by N, regardles of the
exact placement of the bandpass filter.
Compare with the standard Nyquist case: here
we have a lowpass signal which we
downsample and reconstruct:
Lowpass
Lowpass filtered
input spectrum
(original)
Lowpass
Aliasing
Component
Reconstruc.
Original
spectrum
Matlab/Octave Example:
Just take an audio signal and read it into
Matlab/Octave, and filter it with our previous
low pass filter (e.g. Kaiser Window with
Beta=8),
x=wavread('04_topchart.wav');
%listen to it:
sound(x,32000)
%Look at its spectrum:
freqz(x)
This is the spectrum of our original. Observe its
already low pass characteristic.
Now we can low pass filter it. We take our
Kaiser Window low pass filter design from slides
Nr. 6,
n=0:31;
%ideal impulse response:
h=sin(0.33*pi*(n-15.5))./(pi*(n-15.5));
%Kaiser window:
hk=kaiser(32,8)';
%multiply ideal filter and Kaiser window:
hfilt=hk.*h;
xlp=conv(x,hfilt);
freqz(xlp)
Observe that beginning at frequency 0.5 we
have indeed much attenuation and hardly any
signal left.
Now we can down-sample it by a factor of N=2,
xds=xlp(1:2:end);
freqz(xds)
Observe that we now obtain the “streched”
spectrum.
Listen to it:
sound(xds,16000)
It should sound more “muffled”, but otherwise
the same, but at now half the sampling rate!
Now we can upsample again,
xups=zeros(2*max(size(xds)),1);
xups(1:2:end)=xds;
freqz(xups);
Observe the “shrinking” and periodic
continuation of the spectrum, the aliasing
component at the high frequencies.
Listen to the signal including aliasing,
sound(xups,32000);
Now low pass filter the result,
xupslp=conv(xups,hfilt);
freqz(xupslp)
Observe that now we removed the aliasing
component at high frequencies.
Now listen to it,
sound(xupslp,32000);
Observe: it should now sound the same as at
the lower sampling rate, but now at the higher
sampling rate of 32 kHz! (Possible differences
are due to not sufficiently attenuated aliasing).
Effects in the z-Domain
The z-Transform is a more general transform
than the Fourier transform, and we will use it to
obtain perfect reconstruction in filter banks and
wavelets. Hence we will now look at the effects
of sampling and some more tools in the zdomain.
Since we usually deal with causal systems in
practice, we use the 1-sided z-Transform,
defined as
∞
X z= ∑ x n z−n
n=0
First observe that we get our usual frequency
response if we evaluate the z-tranform along
the unit circle in the z-domain,
j
z=e
What is now the effect of multiplying our
signal with the delta impulse train in the zdomain? To see this we simply apply the ztransform,
∞
d
X z = ∑ x n N n z−n
1
=
N
1
=
N
n=0
N −1 ∞
−j
∑ ∑ x ne
k =0 n=0
N −1
−j
∑ X e
2
⋅k
N
−n
⋅z
2
⋅k
N
⋅z
k =0
or, in short,
1
d
X z=
N
N −1
∑ X e
k =0
−j
2
⋅k
N
⋅z
This is very similar to the Fourier transform
formulation, just that we now don't have
frequency shifts for the aliasing terms, but a
multiplication of their exponential functions to
z.
The next effect is the removal or re-insertion
of the zeros from or into the signal. Let's
again use our definition y m= x d mN ,
meaning the y(m) is the signal without the
zeros. Then the z-transform becomes,
∞
Y Z = ∑ y m z−m=
∞
m=0
= ∑ x d mN z−m=
m=0
Replacing the sum index m (the lower sampling
rate) by the higher sampling rate n=mN, and
observing that the sequence x d n contains
the zeros, with x d n=0 for n≠mN , this
results in
∞
=∑ x d n z−n/ N = X d z 1 / N
n=0
Observe the 1/N in the exponent of z! In short,
we get
d
1/ N
Y Z = X z
This exponent 1/N of z now correponds to the
stretching of our frequency scale in the Fourier
spectrum.
Another very useful new tool is the so-called
modulation. This is the multiplication of our
signal with a periodic function, for instance an
exponential function. It can be written as
− j ⋅n
x M n:= x n⋅e
.
Observe that the modulation function here has
a periodicity of 2 / M . Its z-transform hence
becomes
M
X M z=
∞
∑
n=0
− j ⋅n
M
x n⋅e
X M z = X e
⋅z
n
jM
⋅z
here again we have this rotation of z by an
exponential factor.
Observe that this has the effect of simply
shifting the frequency response by M in
the Fourier spectrum, which can be seen by
simply replacing z by e j to obtain the
frequency response. But instead of multiple
frequency shifts and adds in the downsampled
case, here we only have a single shift.
An intersting case is obtained if we set M = .
Then the modulating function is just a
sequence of +1,-1,+1,..., (as can be seen by
using e j ⋅n as a signal, with n=0,1,2,...) and
multiplying this with our signal results in a
frequency shift of . If we have a real valued
low pass signal, for instance, this will then be
shifted by , and we will obtain a high pass.
In this way we can turn the impulse response of
a low pass into a high pass, and vice versa.
We see that this is a simple method to obtain a
high pass filter from a low pass filter. We simply
design a low pass, the take its impulse
response, and invert the sign of every second
sample, and the result is a high pass!
In a similar way we can also obtain a band
pass from a low pass, we just need the general
j ⋅n
modulating function e M and multiply it with
the impulse response of our low pass filter.
What was around frequency zero now after
modulation appears around frequency M ,
and we have a bandpass with center frequeny
M .
This is a useful "trick", because there are many
design methods for low pass filters, but not so
many for the other types, and because we can
obtain filters with the same properties at
multiple frequencys (we simply "copy" a filter
to different frequencies). Observe that in
general we will obtain a complex valued
impulse response using this approach. The
resulting spectrum becomes one-sided. If we
want to obtain real valued filters and impulse
responses, we have to make the spectrum
symmetric around zero again. We can do this
by simple take the real parts of the complex
impulse response (in that case that symmetric
extension has the same sign as the original
spectrum components) or we take the
imaginary part (in that case we obtain the
opposite sign for the symmetric extension).
In summary: with modulation we can shift a low
pass spectrum to any desired frequency to
obtain a desired filter, and using the real or
imaginary part we can then obtain a real
valued filter.
Another important tool is the reversal of the
ordering of a finite length signal sequence,
with length L (meaning x(n) is non-zero only
for n=0,... , L−1 ),
x r n:= x L−1−n.
Its z-transform is
∞
X r z= ∑ x L−1−n⋅z−n
n=0
we can now reverse the order of the
summation (of course without affecting the
result) by starting at the highest index, going to
the lowest, replacing the index n by the
expression L−1−n' (index substitution),
∞
X r z= ∑ x n' ⋅z− L−1−n '
n ' =0
− L−1
=z
or, in short,
X r z = z
−1
⋅X z
− L−1
−1
⋅X z
So what we obtain is the inverse of z in the ztransform (which signifies the time reversal),
and a factor of z− L−1 , which is simply a delay
of L-1 samples! Important here is the inverse of
z.
What difference does this make in our Fourier
spectrum, replacing z by e j ? We obtain
X − instead of X . For real valued
signals this only makes a difference for the
signs (phases) of our frequency responses,
because of the spectral symmetries for real
valued signals. The magnitudes are identical.
This can still be of importance, for instance in
filter banks with aliasing cancellation. Here the
different signs also change the sign of the
aliasing components, and that can make the
difference between aliasing components
cancelling between different bands or adding
up!
An example is the 2 band Haar filter bank,
where the high pass impulse responese on one
side has to be time reversed to obtain perfect
reconstruction.
For complex valued signals, the negative and
positive frequencies can be completely
different, and hence time-reversal would make
a bigger difference.

