บทสรุปผู้บริหารApr 58 Eng2_วิ_
advertisement
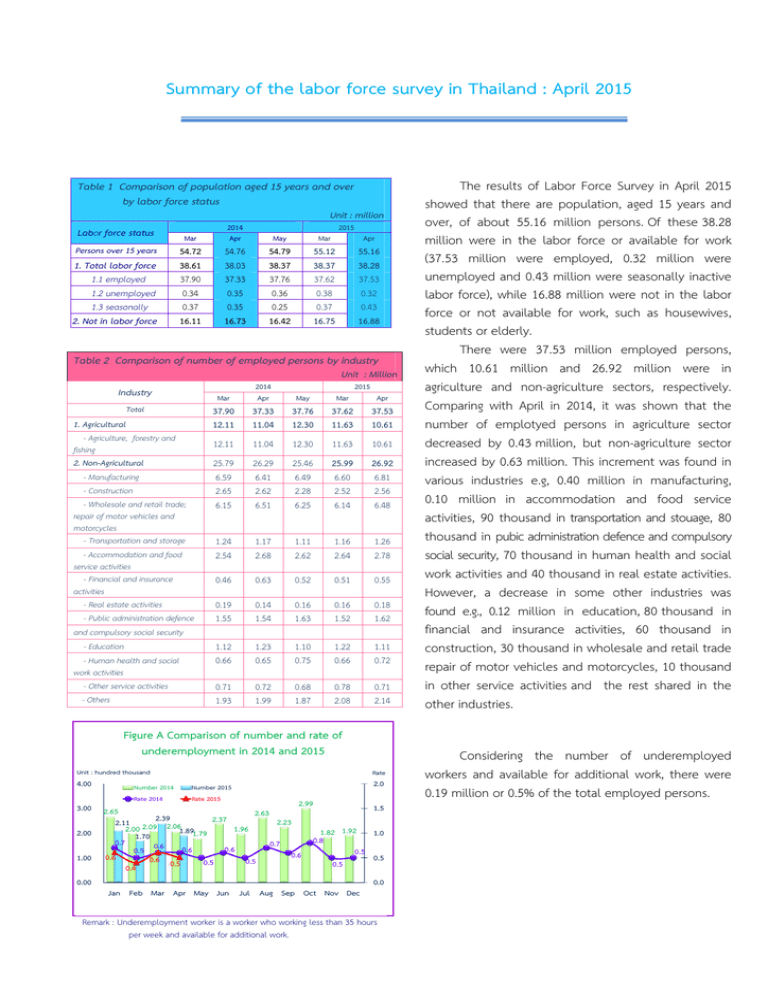
Summary of the labor force survey in Thailand : April 2015 Table 1 Comparison of population aged 15 years and over by labor force status Unit : million Labor force status Persons over 15 years 1. Total labor force 1.1 employed 1.2 unemployed 1.3 seasonally 2. Not in labor force Mar 2014 Apr May Mar 2015 Apr 54.72 38.61 37.90 0.34 0.37 16.11 54.76 38.03 37.33 0.35 0.35 16.73 54.79 38.37 37.76 0.36 0.25 16.42 55.12 38.37 37.62 0.38 0.37 16.75 55.16 38.28 37.53 0.32 0.43 16.88 Table 2 Comparison of number of employed persons by industry Unit : Million Industry Total 1. Agricultural - Agriculture, forestry and fishing 2. Non-Agricultural - Manufacturing - Construction - Wholesale and retail trade; repair of motor vehicles and motorcycles - Transportation and storage - Accommodation and food service activities - Financial and insurance activities - Real estate activities - Public administration defence and compulsory social security - Education - Human health and social work activities - Other service activities - Others Mar 2014 Apr May Mar 2015 Apr 37.90 12.11 37.33 11.04 37.76 12.30 37.62 11.63 37.53 10.61 12.11 11.04 12.30 11.63 10.61 25.79 6.59 2.65 6.15 26.29 6.41 2.62 6.51 25.46 6.49 2.28 6.25 25.99 6.60 2.52 6.14 26.92 6.81 2.56 6.48 1.24 2.54 1.17 2.68 1.11 2.62 1.16 2.64 1.26 2.78 0.46 0.63 0.52 0.51 0.55 0.19 1.55 0.14 1.54 0.16 1.63 0.16 1.52 0.18 1.62 1.12 0.66 1.23 0.65 1.10 0.75 1.22 0.66 1.11 0.72 0.71 1.93 0.72 1.99 0.68 1.87 0.78 2.08 0.71 2.14 Figure A Comparison of number and rate of underemployment in 2014 and 2015 Unit : hundred thousand 4.00 3.00 2.00 1.00 Number 2014 Rate 2014 Rate Number 2015 Rate 2015 2.0 2.99 1.5 2.65 2.63 2.39 2.37 2.23 2.11 2.09 2.06 1.96 2.00 1.891.79 1.82 1.92 1.0 1.70 0.8 0.7 0.7 0.6 0.6 0.6 0.5 0.5 0.6 0.6 0.5 0.6 0.5 0.5 0.5 0.5 0.4 0.00 0.0 Jan Feb Mar Apr May Jun Jul Aug Sep Oct Nov Dec Remark : Underemployment worker is a worker who working less than 35 hours per week and available for additional work. ] The results of Labor Force Survey in April 2015 showed that there are population, aged 15 years and over, of about 55.16 million persons. Of these 38.28 million were in the labor force or available for work (37.53 million were employed, 0.32 million were unemployed and 0.43 million were seasonally inactive labor force), while 16.88 million were not in the labor force or not available for work, such as housewives, students or elderly. There were 37.53 million employed persons, which 10.61 million and 26.92 million were in agriculture and non-agriculture sectors, respectively. Comparing with April in 2014, it was shown that the number of emplotyed persons in agriculture sector decreased by 0.43 million, but non-agriculture sector increased by 0.63 million. This increment was found in various industries e.g, 0.40 million in manufacturing, 0.10 million in accommodation and food service activities, 90 thousand in transportation and stouage, 80 thousand in pubic administration defence and compulsory social security, 70 thousand in human health and social work activities and 40 thousand in real estate activities. However, a decrease in some other industries was found e.g., 0.12 million in education, 80 thousand in financial and insurance activities, 60 thousand in construction, 30 thousand in wholesale and retail trade repair of motor vehicles and motorcycles, 10 thousand in other service activities and the rest shared in the other industries. Considering the number of underemployed workers and available for additional work, there were 0.19 million or 0.5% of the total employed persons. 2 Figure B Comparison of number and underemployment rate by sex in 2014-2015 Unit : hundred thousand persons 2.00 1.61 Number female Rate male Rate female 1.5 1.90 1.47 1.47 1.36 1.24 1.26 1.23 1.23 0.9 1.20 1.18 1.09 1.16 0.8 1.13 1.07 1.00 1.04 0.87 1.00 0.7 0.7 0.88 0.73 0.7 0.7 0.83 0.6 0.89 0.6 0.6 0.6 0.71 0.6 0.6 0.76 0.6 0.70 0.93 0.6 0.75 0.5 0.69 0.5 0.7 0.6 0.6 0.6 0.58 0.5 0.5 0.5 0.5 0.4 0.4 0.5 0.4 0.4 0.4 0.4 0.3 1.37 1.27 1.00 Rate Number male 0.00 1.0 Considered underemployment rate by sex, it was shown that the overall underemployment rate of male was higher than female. In April 2015, underemployment rate of male (0.6%) and female (0.4%). 0.5 0.0 Jan Feb Mar Apr May Jun Jul Aug Sep Oct Nov Dec Jan Feb Mar Apr 2014 2015 Figure C Comparison of number and rate of unemployment in 2014 and 2015 Rate Unit : hundred thousand persons 5.00 4.00 4.48 4.04 3.61 3.31 3.413.783.44 3.62 3.24 1.00 3.79 3.16 3.00 2.00 Number 2014 Rate 2014 1.1 0.9 0.9 1.0 0.8 3.11 2.87 0.9 0.9 0.9 0.9 1.1 3.0 Number 2015 Rate 2015 2.5 2.0 2.89 1.5 2.10 2.20 1.0 0.7 0.8 0.8 1.0 0.6 0.6 0.00 0.5 0.0 Jan Feb Mar Apr May Jun Jul Aug Sep Oct Nov Dec Figure D Comparison of unemployment rate by sex in 2014 - 2015 Rate 1.40 0.80 male 1.2 1.1 1.20 1.00 In April 2015, the total number of unemployed persons were 0.32 million or 0.9% of the total labor force and decrease of 20 thousand (from 0.34 million to 0.32 million) comparing to the same period as in 2014. And, it showed an decrease of 54 thousand (from 0.38 million to 0.32 million) in March 2015. 1.0 1.0 0.9 0.9 0.9 0.9 0.9 0.9 0.9 0.8 1.0 1.0 female 0.9 0.8 0.8 0.8 0.7 0.9 0.9 0.8 0.7 0.7 0.6 0.5 0.6 0.60 1.2 1.1 1.0 1.0 0.4 0.40 0.20 0.00 Jan Feb Mar Apr May Jun Jul Aug Sep Oct Nov Dec Jan Feb Mar Apr 2014 2015 Comparing to the unemployment rate by sex in April 2015, it was found that, unemployment rate of male was higher than female (0.9% and 0.8% respectively). 3 Out of 0.32 million, there were 0.15 million having never worked (70 thousand were male and 81 thousand were female) and 0.17 million had ever, among these, the number of unemployed persons who ever worked increased by 1 thousand (from 0.172 million to 0.173 million), comparing to the same period as in 2014. It was found that 0.17 million distributed in 3 sectors i.e. 82 thousand in services and trade, 72 thousand in manufacturing and 19 thousand in agriculture. Figure E Number of unemployed by experience of work in April 2015 Agriculture 19 thousand female 81 thousand male 70 thousand ever worked never worked 173 thousand 151 thousand manufacturing 72 thousand Service and Trade 82 thousand Figure F Comparing of unemployment rate by age group in 2014 and 2015 Percent 7.5 Youth(15-24)years Adoult(25years and over) 5.0 Regarding the unemployment rates by age groups, there were 4.2% in a youth group (aged 15-24 years) and 0.4% in adults group (age 25 years and over). The unemployment rate in the youth group decreased from 4.4% to 4.2% comparing to the same period as in 2014, and decreased from 4.9% to 4.2% comparing to March in 2015. 2.5 0.5 0.5 0.4 0.5 0.4 0.6 0.5 0.3 0.4 0.4 0.3 0.3 0.7 0.5 0.5 0.4 Jan Feb Mar Apr May Jun Jul Aug Sep Oct Nov Dec Jan Feb Mar Apr 0.0 2014 2015 Figure G Comparing of number and rate of unemployment by level educational attainment in April 2014 and 2015 Education level 1.39 (1.7) 1.50 (1.8) Higher level Upper secondary 0.49 (0.8) 0.72 (1.2) Lower secondary 0.71 (1.2) 0.59 (1.0) 2015 2014 0.54 (0.6) 0.40 (0.5) Elementary None/less than elementary 0.00 0.11 (0.1) 0.23 (0.2) 0.50 Number(00,000), Percent 1.00 1.50 2.00 For level of educational attainment of unemployed persons in April 2015, it was found that most of them had higher level (139 thousand or 1.7%), followed by those with lower secondary level (71 thousand or 1.2%), primary level (54 thousand or 0.6%), upper secondary level (49 thousand or 0.8%) and illiterate and less than primary level (11 thousand or 0.1%). Comparing to the same period in 2014, the result showed that the number of unemployed persons with elementary level increased of 14 thousand, lower secondary level of 12 thousand. However, those with upper secondary level decreased of 23 thousand, illiterate and less than primary level of 12 thousand and higher level of 11 thousand. 4 Figure H Comparing of number of unemployed and unemployment rate by region in April 2014 and 2015 a 2014 and 2015 Region 2015 2014 0.56 (1.1) 0.64 (1.3) South 0.99 (1.0) 0.65 (0.7) 0.51 (0.8) 0.43 (0.7) 0.74 (0.6) 1.19 (1.0) Northeast North Central 0.44 (0.8) 0.53 (1.0) Bangkok 0.0 0.5 Number(00,000), Percent 1.0 1.5 2.0 Concerning the number of unemployed and the unemployment rate by region, it was found that those in the Northeast was the highest with (99 thousand or 1.0%), followed by the Central (74 thousand or 0.6%), the South (56 thousand or 1.1%), the North (51 thousand or 0.8%) and Bangkok (44 thousand or 0.8%). Comparing to the same period as in 2014, the number of unemployment persons of the whole kingdom decreased from 0.34 million to 0.32 million. Concerning by region, it decrease in the Central, Bangkok and the South. However, it increases in the Northeast and the North.

