Compton scattering using X-Ray
advertisement

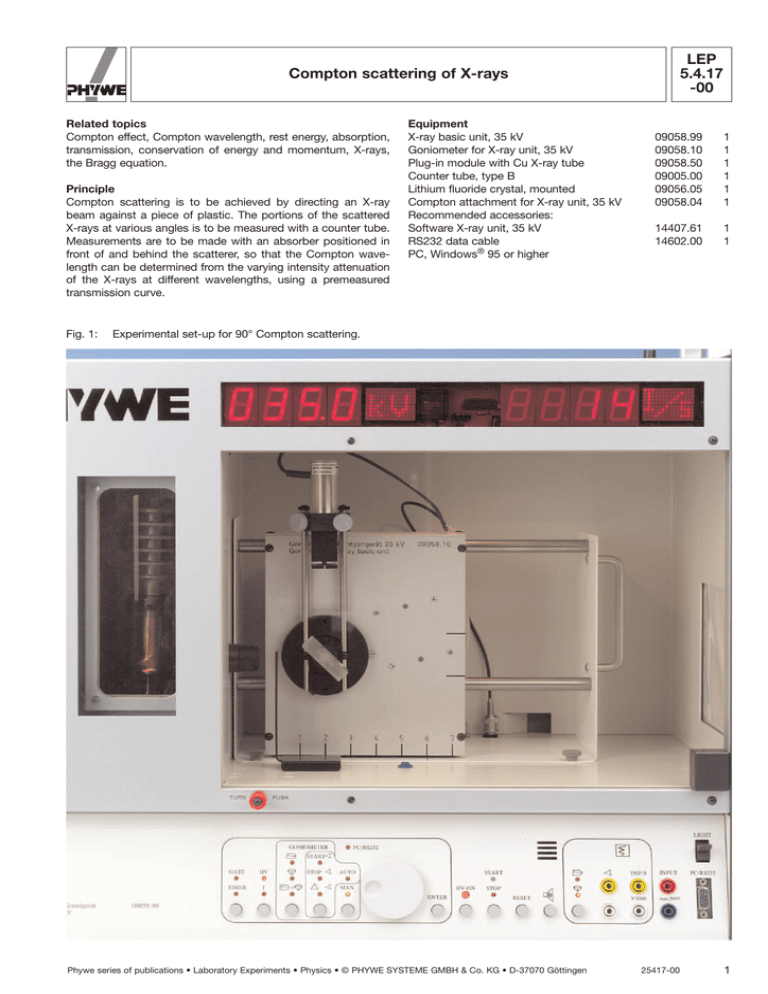
LEP 5.4.17 -00 Compton scattering of X-rays Related topics Compton effect, Compton wavelength, rest energy, absorption, transmission, conservation of energy and momentum, X-rays, the Bragg equation. Principle Compton scattering is to be achieved by directing an X-ray beam against a piece of plastic. The portions of the scattered X-rays at various angles is to be measured with a counter tube. Measurements are to be made with an absorber positioned in front of and behind the scatterer, so that the Compton wavelength can be determined from the varying intensity attenuation of the X-rays at different wavelengths, using a premeasured transmission curve. Fig. 1: Equipment X-ray basic unit, 35 kV Goniometer for X-ray unit, 35 kV Plug-in module with Cu X-ray tube Counter tube, type B Lithium fluoride crystal, mounted Compton attachment for X-ray unit, 35 kV Recommended accessories: Software X-ray unit, 35 kV RS232 data cable PC, Windows® 95 or higher 09058.99 09058.10 09058.50 09005.00 09056.05 09058.04 1 1 1 1 1 1 14407.61 14602.00 1 1 Experimental set-up for 90° Compton scattering. Phywe series of publications • Laboratory Experiments • Physics • © PHYWE SYSTEME GMBH & Co. KG • D-37070 Göttingen 25417-00 1 LEP 5.4.17 -00 Compton scattering of X-rays Tasks 1. The transmission of an aluminium absorber is to be determined as a function of the wavelength of the X-rays by means of Bragg scattering and the measured values plotted graphically. 2. A scatterer is to be used and the intensity of the X-rays scattered at different angles determined. The intensity attenuation which occurs on placing an aluminium absorber in front of, and behind, the scatterer is to be determined for the same angles as previously, and the different transmission coefficients then calculated. 3. The different transmission coefficients and the transmission curve are to be used to determine the changes in wavelengths. 4. The Compton wavelength for 90° scattering is to be determined and compared with the theoretical value. Set-up and procedure Part 1: Determination of the transmission of aluminium Fix the diaphragm tube with 2 mm diameter aperture in the X-ray outlet cylinder of the plug-in module that is to be used. With the X-ray unit switched off, connect the goniometer to the SUB-D socket in the base plate of the experimenting area. Fit the counter tube in the counter tube holder to the stop and screw it tight. Connect the counter tube cable to the BNC socket in the base plate of the experimenting area. Set the counter tube holder to the right stop and the goniometer with mounted LiF crystal in the middle position. Lock each of them in these positions. The following settings are recommended: — Anode voltage UA = 35 kV; Anode current IA = 1 mA Determine the pulse rate N1(q) of the X-rays reflected by the crystal in angle steps of 0.1° between the glancing angle q = (7.5-9.5)°, by means of synchronized rotation of the crystal and the counter tube in the angular relationship 2:1. Use a measuring time of 100 s. Insert the aluminium absorber between the X-ray outlet and the crystal and repeat the above procedure to measure the pulse rate N2(q). Calculate the wavelength l as a function of the glancing angle q, using the Bragg equation: 2d sin q = n l (lattice constant d = 201.4 pm) (1) If the measured number of pulses is N, then the relative error of the measurement is given by the ratio: ∆N 2N 1 N N 2N (2) At high pulse rates N, because of the dead time t ≈ 90 ms of the counter tube, not all incoming photons are recorded. The true pulse rate N* must therefore be determined by means of the relation: N (3) N* 1 tN The corrected pulse rates can now be used to calculate the transmission values as a function of wavelength l and plot them graphically (Fig. 4). Part 2: The determination of Compton scattering Remove the crystal and replace it with the plastic scatterer. Position this at an angle of 135° (see Fig. 2). Replace the diaphragm tube with d = 2 mm aperture with the one with d = 5 mm aperture. Turn the counter tube to 90° and measure the pulse rates, using the following set-ups: N3: with plastic scatterer but without the aluminium absorber N4: with plastic scatterer and with the aluminium absorber in position 1 N5: with plastic scatterer and with the aluminium absorber in position 2 For the measurement of N5, clamp the absorber on the rods of the counter tube holder. Fig. 2: Schematic representation of the 90° Compton scattering arrangement. Fig. 3: Momentum relationships in Compton scattering (p1/p2 = photon momentum before/after collision, m · S v = electron momentum after collison. 2 25417-00 Phywe series of publications • Laboratory Experiments • Physics • © PHYWE SYSTEME GMBH & Co. KG • D-37070 Göttingen LEP 5.4.17 -00 Compton scattering of X-rays To obtain the necessary exactitude, use a measuring time of 3 x 100 s for each measurement and take the mean value for the calculation of the transmission coefficient. If necessary, the dead time and background radiation must be taken into account to obtain the real pulse rates N*. Note: Never expose the counter tube to primary radiation for a longer length of time. Theory and evaluation A schematic representation of the scattering geometry of the Compton effect is shown in Fig. 3. The incident photon suffers a loss in energy when it is scattered from its original direction under scattering angle a, while the free electron is emitted under angle b from the collision point with a gain in energy. From the principle of conservation of energy and momentum (and taking the relativistic electron mass into account), a change in the wavelength ∆l of the scattered photon as a function of the scattering angle finally occurs: ∆l h h a 11 cosa 2 2 sin2 a b m0c m0c 2 where: Planck's constant The velocity of light The rest mass of the electron 0.4 T 0.35 T1 0.3 T2 (4) 0.25 h = 6.626 · 10-34Js c = 2.998 · 108 m/s-1 m0 = 9.109 · 10-31 kg The change in wavelength for 90° scattering is called the Compton wavelength, and contains the energy: Ec h · fc h·c h m0c2 ; lc 2.426 pm lc m0c (5) ∆l 0.2 where Ec is the electron rest energy. 55 Fig. 4 shows the situation for 90° Compton scattering with the transmission coefficients: T1 T2 32.4 Imp>s N*4 0.337±1.6% ; N*3 96.2 Imp>s 60 65 l/pm Fig. 4: Transmission curve of aluminium. Experimental set-up for 90° Compton scattering. 27.8 Imp>s N*5 0.289±1.7% ; N*3 96.2 Imp>s It can be seen that T1 >T2. The T values recorded in Fig. 4 yield a satisfactory result, a wavelength difference of : ∆l = lc = (2.5±0.4) pm. The results for the smaller scattering angles do not correspond well with the theoretical prediction, they nevertheless show that with decreasing scattering angle, the difference in wavelength also decreases. Phywe series of publications • Laboratory Experiments • Physics • © PHYWE SYSTEME GMBH & Co. KG • D-37070 Göttingen 25417-00 3 LEP 5.4.17 -00 4 Compton scattering of X-rays 25417-00 Phywe series of publications • Laboratory Experiments • Physics • © PHYWE SYSTEME GMBH & Co. KG • D-37070 Göttingen


