5.4(1)
MULTISIM DEMO 5.4*: TIME CONSTANTS IN RC CIRCUITS
While we know numerically that in an RC circuit the value of the resistance affects the time
constant, how does variation of the resistor affect the response graphically?
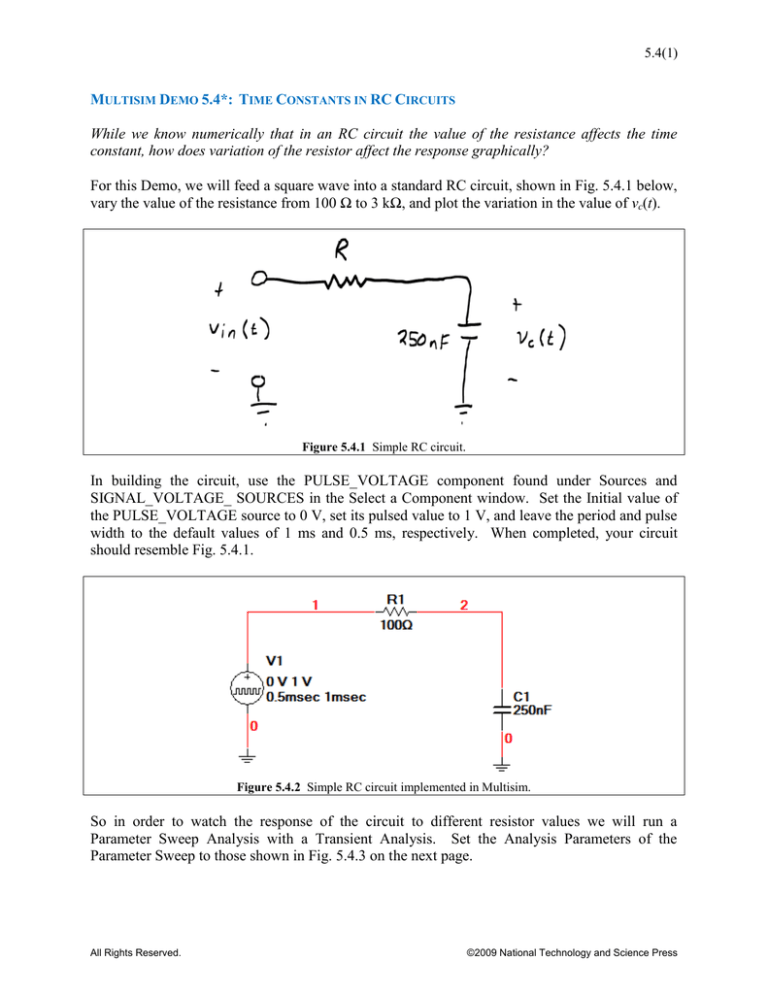
For this Demo, we will feed a square wave into a standard RC circuit, shown in Fig. 5.4.1 below,
vary the value of the resistance from 100 Ω to 3 kΩ, and plot the variation in the value of vc(t).
Figure 5.4.1 Simple RC circuit.
In building the circuit, use the PULSE_VOLTAGE component found under Sources and
SIGNAL_VOLTAGE_ SOURCES in the Select a Component window. Set the Initial value of
the PULSE_VOLTAGE source to 0 V, set its pulsed value to 1 V, and leave the period and pulse
width to the default values of 1 ms and 0.5 ms, respectively. When completed, your circuit
should resemble Fig. 5.4.1.
Figure 5.4.2 Simple RC circuit implemented in Multisim.
So in order to watch the response of the circuit to different resistor values we will run a
Parameter Sweep Analysis with a Transient Analysis. Set the Analysis Parameters of the
Parameter Sweep to those shown in Fig. 5.4.3 on the next page.
All Rights Reserved.
©2009 National Technology and Science Press
5.4(2)
Figure 5.4.3 Parameter Sweep Values.
Make sure you select to run a Transient Analysis; set the parameters and values of that
simulation to what is shown in Fig. 5.4.4 below. The variable we want to measure is the voltage
across the capacitor which can be represented by the simple variable V(2) (using the notation of
the circuit in Fig. 5.4.2).
Figure 5.4.4 Transient Analysis Values.
When you are ready, Simulate. The plot generated should resemble that shown on the next page.
All Rights Reserved.
©2009 National Technology and Science Press
5.4(3)
Figure 5.4.5 RC charge/discharge curves for varying resistance values.
From basic theory (
R = 100 Ω,
R = 583.3 Ω,
R = 1066.7 Ω,
R = 1550 Ω,
R = 2033.3 Ω,
R = 2516.7 Ω,
R = 3000 Ω,
RC ) we know that for this circuit when:
τ = 25 μs
τ = 145.83 μs
τ = 266.93 μs
τ = 387.5 μs
τ = 508.33 μs
τ = 629.18 μs
τ = 750.0 μs
If we compare these values to their corresponding plots, things start to make sense. The circuit
with the lowest time constant quickly reaches the input voltage values (it is the only circuit with
a response that looks similar to the square wave input signal). As we keep increasing the time
constant, the capacitor charges up less and takes longer to decay.
All Rights Reserved.
©2009 National Technology and Science Press


