© Copyright F.L. Lewis 1999
All rights reserved
Updated: Tuesday, August 28, 2001
SECOND ORDER SYSTEMS
The figures in this lecture are taken from Dorf and Bishop, Modern Control
Systems, edition 8.
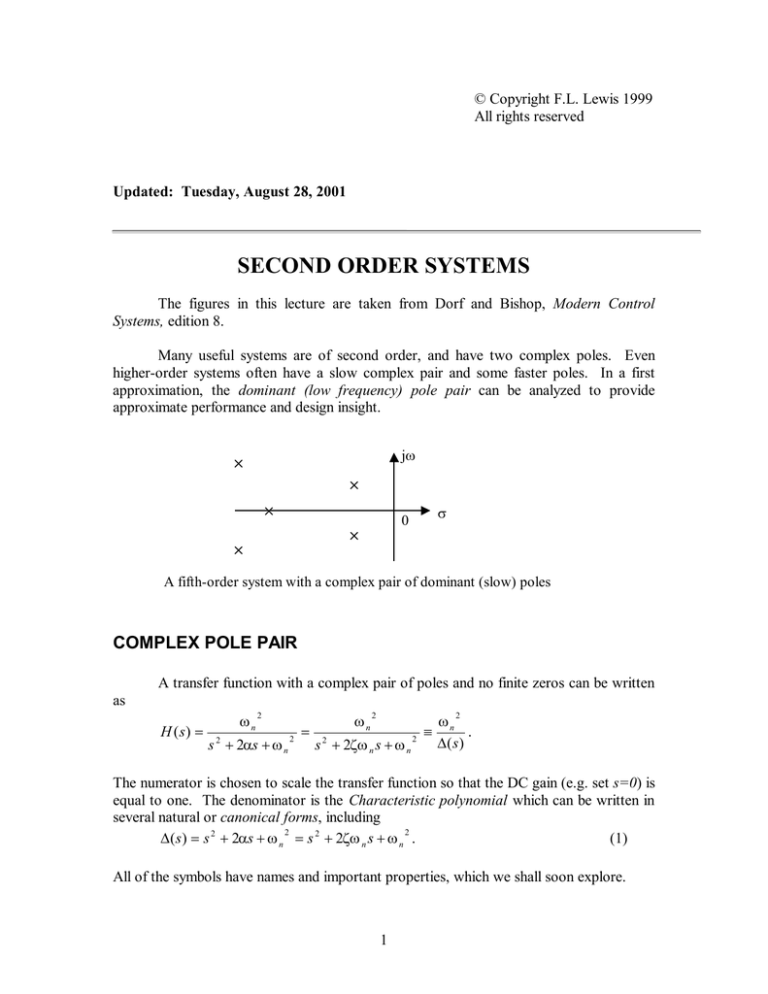
Many useful systems are of second order, and have two complex poles. Even
higher-order systems often have a slow complex pair and some faster poles. In a first
approximation, the dominant (low frequency) pole pair can be analyzed to provide
approximate performance and design insight.
jω
σ
0
A fifth-order system with a complex pair of dominant (slow) poles
COMPLEX POLE PAIR
A transfer function with a complex pair of poles and no finite zeros can be written
as
H (s) =
ωn
2
s 2 + 2αs + ω n
2
=
ωn
2
ωn
.
∆( s )
2
s 2 + 2ζ ω n s + ω n
2
≡
The numerator is chosen to scale the transfer function so that the DC gain (e.g. set s=0) is
equal to one. The denominator is the Characteristic polynomial which can be written in
several natural or canonical forms, including
2
2
∆(s ) = s 2 + 2αs + ω n = s 2 + 2ζ ω n s + ω n .
(1)
All of the symbols have names and important properties, which we shall soon explore.
1
One may write
2
∆(s ) = s 2 + 2αs + ω n = ( s + α ) 2 + β2
where
β2 + α 2 = ω n .
2
This shows that, if α 2 < ω n , the polynomial ∆(s ) describes a complex pair of poles at
s = − α ± jβ.
2
In this class we do not use 'j', but as engineers prefer to keep the complex pole factors
together in the quadratic form (1).
The figure shows the pole locations. The
real part of the poles is -α and the imaginary part
is jβ. The norm of the vector from the origin to
the pole is ωn, which is known as the natural
frequency.
To link the two forms in (1) we define the
damping ratio as
α
ζ =
,
ωn
which defines it as
α
ζ = cosθ = − cos ϕ =
.
ωn
For complex poles in the left-half plane one has 0 < ζ < 1 . If 0 > ζ > − 1 then one has a
complex pair in the right-half plane (e.g. unstable complex pair). Note that one may
write
β= ω n − α 2 = ω n 1 − ζ
2
2
.
TIME DOMAIN MEANING OF VARIABLES
The symbols appearing above all have well-defined meanings in the time domain.
Referring to the Laplace transform table, the impulse response of the system with transfer
function
2
ωn
H (s) = 2
( s + α ) 2 + β2
is given by
2
ω n − αt
e sin βt u − 1 (t ) ,
β
2
which is plotted for 0 < ζ < 1 in the figure. This is known as the underdamped case. The
figure clearly shows the meaning in the time domain of the real part -α of the poles,
which provides the exponential decay term. Having in mind the standard form for
sinusoids sin 2π t , the period of the oscillation is given by
T
2π
T=
.
β
The variable βis known as the oscillation frequency.
Refer to the above equations. If ζ = 0 then α = 0, β= ω n and the poles are at
s = ± jβ on the imaginary axis. This is known as the undamped case. If ζ = 1 then
β= 0,α = ω n and the poles are on the real axis, both at s = − α . In this overdamped
case, the impulse response has the form te − αt . All these various cases are shown below
in the very nice figure from Dorf and Bishop.
3
If ζ > 1 then there are two real poles and we can split the quadratic factor
∆(s ) = s 2 + 2αs + ω n into two real linear factors.
2
STEP RESPONSE AND POV
The step response is given by inverse transforming
2
ωn
H (s)
=
s
s [(s 2 + α ) 2 + β2 ]
to obtain
ω
α
sin βt ] = 1 − n e − αt sin( βt + θ )u − 1 (t )
β
β
where the angle θ = arctan β is shown in the figure above. This is shown in the figure
α
from Dorf and Bishop for various values of damping ratio.
r (t ) = 1 − e − αt [cos βt +
A great advantage of MATLAB is the ease of displaying data in multidimensions
and colors to obtain increased engineering insight. The following figure from Dorf and
Bishop shows this very nicely.
4
An important quantity for characterizing the performance of systems is the
percent overshoot (POV) in the step response. This is defined as
r − r
POV = max ss ×100%
rss
where rmax is the maximum value of the step response and rss is its steady-state value.
Also useful are the rise time tr, which is the time required for the step response to rise
from 0.1 to 0.9 of its steady-state value. The settling time ts is the time required for the
signal to effectively reach its steady-state value.
− t
For a pure exponential r (t ) = 1 − e τ the quantity τ is known as the time constant.
One has τ = 1 . For the pure exponential one has
α
5
t r = 2.2τ
t s = 5τ
(some take t s = 4τ ).
For the damped pole pair, one still has τ = 1 and one may take the settling time as this
α
value, but the signal rises faster and one may approximate for 0.3 ≤ζ ≤0.8 using
2.16ζ + 0.6
tr =
.
ωn
The percent overshoot is a
function of damping ratio, as shown in
the graph from Dorf and Bishop. In fact
one has
POV = 100e
and conversely
− πζ / 1− ζ
(
2
)
1/ 2
ln 2 POV
100
.
ζ =
2
ln 2 POV
+ π
100
(
)
FREQUENCY DOMAIN POINT OF VIEW
The variables mean something in the frequency domain as well, particularly the
damping ratio ζ and the natural frequency ω n . In fact, the quality factor
1 ωn
Q=
=
2ζ
2α
measures the sharpness of the resonant peak in the Bode plot, as shown in the figure
below from Dorf and Bishop. Note that this is effectively determined solely by the
damping ratio. The poles are complex if Q> 1/2.
In terms of the quality factor one may write the characteristic polynomial in the
non-dimensional form
s
∆(s ) =
ω
n
2
1s
+ Q
ω
n
+ 1
The resonant frequency is given for ζ ≤0.7 by
ω r = ω n 1 − 2ζ
2
.
6
The maximum value of the Bode plot at resonance is given by
1
M pω =
.
2ζ 1 − ζ 2
7


