One-Minute Spotlight
The Two-Dimensional (2D) Simulation Tool
Risk analysts must often consider two sources of variation in their models:
•
Uncertainty, where assumptions are uncertain because you have insufficient information
about a fixed, but unknown, value (e.g., the return on an investment, the costs during a
stage of drug development, the amount of oil in a reservoir)
•
Variability, where assumptions change because they describe a population of different
values (e.g., individual body weights in a population, the daily number of products sold
over a year, ages of products in inventory).
Many risk assessments contain both uncertainty and variability, and you should treat the two
sources of variation separately to accurately characterize the risk. The 2D Simulation tool
distinguishes the effects of the two types of variation by running two simulation "loops": an
outer loop for the uncertainty and an inner loop for the variability.
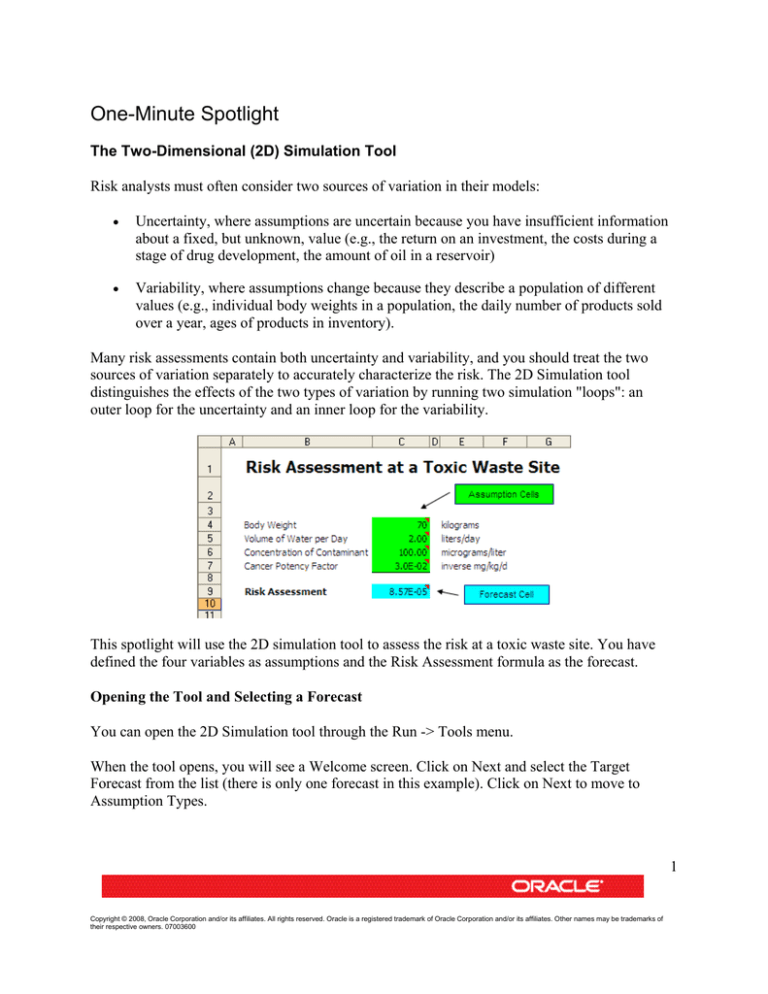
This spotlight will use the 2D simulation tool to assess the risk at a toxic waste site. You have
defined the four variables as assumptions and the Risk Assessment formula as the forecast.
Opening the Tool and Selecting a Forecast
You can open the 2D Simulation tool through the Run -> Tools menu.
When the tool opens, you will see a Welcome screen. Click on Next and select the Target
Forecast from the list (there is only one forecast in this example). Click on Next to move to
Assumption Types.
1
Copyright © 2008, Oracle Corporation and/or its affiliates. All rights reserved. Oracle is a registered trademark of Oracle Corporation and/or its affiliates. Other names may be trademarks of
their respective owners. 07003600
One-Minute Spotlight
Specifying the Assumptions
This step lets you identify and separate the two types of assumptions.
In this example, the uncertain variables are the Concentration of Contaminant in Water and the
CFP (cancer potency factor). While there is a single, fixed value for each, they are uncertain
because you cannot directly measure them.
Body Weight and Volume of Water per Day vary naturally per person across the population, so
these two assumptions are identified as variability. Click on Next to move to Options.
2
Copyright © 2008, Oracle Corporation and/or its affiliates. All rights reserved. Oracle is a registered trademark of Oracle Corporation and/or its affiliates. Other names may be trademarks of
their respective owners. 07003600
One-Minute Spotlight
Specifying the Simulation Options
The final step lets you define how many outer and inner loops you wish to run as well as how
you want to view the output. For this model, you decide to run 100 simulations (outer loop) of
1000 trials (inner loop) each. Click on Run to run the tool.
3
Copyright © 2008, Oracle Corporation and/or its affiliates. All rights reserved. Oracle is a registered trademark of Oracle Corporation and/or its affiliates. Other names may be trademarks of
their respective owners. 07003600
One-Minute Spotlight
Crystal Ball first single-steps one trial (set of random values) for the two uncertain assumptions
(outer loop). Then, with these assumption values frozen, Crystal Ball runs 1000 trials on the two
variability assumptions (inner loop). Crystal Ball saves the results and repeats this process 99
more times.
Analyzing the Results
After completing the simulations, the tool creates a separate workbook with the 2D simulation
results. The results of the simulations appear in a table containing the forecast means, the
uncertainty assumption values, and the statistics (including percentiles) of the forecast
distribution for each simulation. In the results table below, you can view the 95th-percentile
statistics (for the 100 uncertain simulations) in row B39. When you view the forecast chart, you
see a mean value of 1.75E-4.
4
Copyright © 2008, Oracle Corporation and/or its affiliates. All rights reserved. Oracle is a registered trademark of Oracle Corporation and/or its affiliates. Other names may be trademarks of
their respective owners. 07003600
One-Minute Spotlight
The tool also presents the results of the 2D simulations in an overlay chart and a trend chart.
5
Copyright © 2008, Oracle Corporation and/or its affiliates. All rights reserved. Oracle is a registered trademark of Oracle Corporation and/or its affiliates. Other names may be trademarks of
their respective owners. 07003600
One-Minute Spotlight
The overlay chart shows the risk curves (cumulative distributions) for different sets of
uncertainty assumption values. In the chart below, most of the risk curves are clustered densely
toward the center while a few outlier curves are scattered to the right, showing the small
probability of a much greater health risk.
Comparing 2D Simulation to 1D Simulation
An easy, quick way to gauge the effectiveness and importance of 2D simulation is to run a onedimensional simulation, that is, a simulation where all assumptions are treated alike.
In the 2D simulation, you found that the mean for the 95th-percentile statistics (for the 100
uncertain simulations) was 1.75E-04. In the 1D simulation, shown below, the 95th percentile risk
was 2.03E-04, indicating a higher level of risk.
6
Copyright © 2008, Oracle Corporation and/or its affiliates. All rights reserved. Oracle is a registered trademark of Oracle Corporation and/or its affiliates. Other names may be trademarks of
their respective owners. 07003600
One-Minute Spotlight
By treating all the variables alike rather than breaking out the two types, the 1D simulation
appears to have overestimated the level of risk, resulting in possibly unnecessary remediation
costs. The 2D simulation, which addressed the sources of variation in a more precise way,
delivered a more realistic simulation result.
For more information or to contact us, browse to http://www.oracle.com/crystalball
7
Copyright © 2008, Oracle Corporation and/or its affiliates. All rights reserved. Oracle is a registered trademark of Oracle Corporation and/or its affiliates. Other names may be trademarks of
their respective owners. 07003600


