Neurobiology: The nerve cell
TEB
Principle and task
To use a nerve function model to study the following aspects of a nerve cell:
• INTRACELLULAR POTENTIAL AND ACTION POTENTIAL
• Comparison between low and high threshold levels
• Comparison between low and high stimulus levels
• MEMBRANE TIME CONSTANT AND LOW-PASS FILTERING
• Membrane time constant
• Low-pass filtering
• EXCITATORY SYNAPSE
• Depolarisation
• Temporal summation
• Spatial summation
• Synaptic amplification by terminal branches
• Effect of decreasing stimulus
• HEBBIAN SYNAPSE
• Synaptic learning and forgetting
• INHIBITORY SYNAPSE
• Hyperpolarization
• Spacial inhibitory-excitatory summation
• VETO SYNAPSE
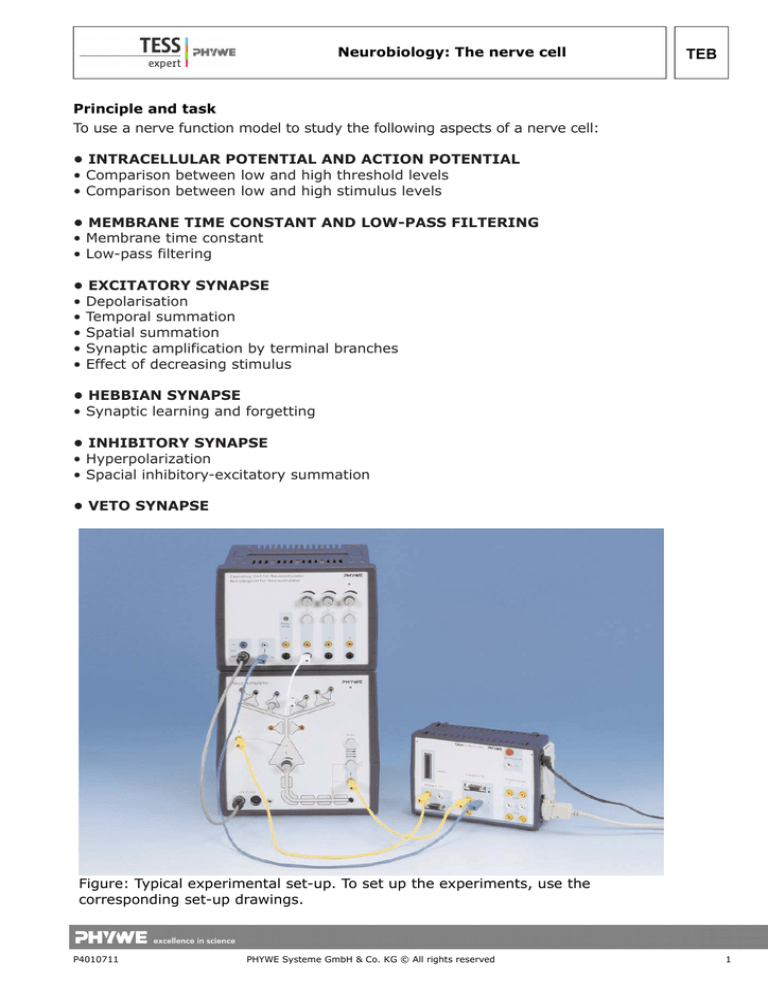
Figure: Typical experimental set-up. To set up the experiments, use the
corresponding set-up drawings.
P4010711
PHYWE Systeme GmbH & Co. KG © All rights reserved
1
TEB
Neurobiology: The nerve cell
Equipment
1 Neurobiology Lab
PC, Windows® 95 or higher
65963-11
Set-up and procedure
INTRACELLULAR POTENTIAL AND ACTION POTENTIAL (FIG. 1)
Internet search keywords: Intracellular potential, resting potential, action potential,
stimulus, nerve cell, neuronal stimulation.
Action potential arises by influx of sodium ions through the sodium channels of the nerve
cells. Stimulus movement along the axon occurs due to the consecutive influx of sodium
ions along its cell membrane.
The measurement method of this experiment differs from that of the other experiments so
that action potential can be displayed (together with intracellular potential). In the other
experiments (with the exception of the experiments dealing with the excitatory synapse)
presynaptic signal strength is shown instead, along with intracellular potential.
Experiment set-up according to Fig. 1 and Fig. 2: Software: select the fast measurement
mode (trigger +25%, rising, data transfer to "Analog in 2", frequency 10 kHz, 1024 values,
show channels "Analog in 1" and "Analog in 2", X data: time, range ±10V for "Analog in 1"
and ±0.1V for "Analog in 2").
The two experiments described here show the effect of the threshold level of the
Neurosimulator and the stimulus level emitted by the operating unit.
2
PHYWE Systeme GmbH & Co. KG © All rights reserved
P4010711
Neurobiology: The nerve cell
TEB
Fig. 1: Experimental set-up
P4010711
PHYWE Systeme GmbH & Co. KG © All rights reserved
3
TEB
Neurobiology: The nerve cell
Fig 2: Window for settings
a)
Comparison between low and high threshold levels: Graph: maximum stimulus
intensity (turn knob of operating unit to the right) and low threshold (here: 0) creates fast
frequency of action potential (see Fig. 3). Graph: same stimulus intensity, but this time,
increase threshold level, therefore lower frequency of action potential (see Fig. 4).
b)
Comparison between low and high stimulus levels: Perform the experiment
comparing low and high stimulus intensities with one another, while keeping threshold at 0
(turn threshold knob to left).
4
PHYWE Systeme GmbH & Co. KG © All rights reserved
P4010711
Neurobiology: The nerve cell
TEB
Fig. 3
Fig 4
MEMBRANE TIME CONSTANT AND LOW-PASS FILTERING (FIG. 5)
Internet search keywords:
Resting potential, membrane time constant, low-pass filtering. Experiment setup (see Fig.
5 and Fig. 6):
Here, as in all the other experiments in which the intracellular potential is measured
together with a stimulus level, choose the normal measurement mode with the following
settings: get value every 2 ms, start and end measurement on key press, show channels
"Analog in 1" and "Analog in 2", X data: time, range ±10 V for both "Analog in 1" and for
"Analog in 2", select the following displays: digital displays 1 and 2, diagram 1.
P4010711
PHYWE Systeme GmbH & Co. KG © All rights reserved
5
TEB
Neurobiology: The nerve cell
After clicking on button "Continue", an intracellular resting potential of -7 V is shown, which
is 100 times the resting potential in a real nerve cell.
Fig. 5: Experimental set-up
6
PHYWE Systeme GmbH & Co. KG © All rights reserved
P4010711
Neurobiology: The nerve cell
TEB
Fig. 6: Window for settings
a) Membrane time constant (see Fig. 7) Graph: membrane time constant. Since nerve
membranes have capacitative properties and electrical resistance, intracellular
potential behaves like the charging and discharging of an electrical capacitor. In
nerve cells, the time constant is 10 to 50 ms, i.e. this amount of time is needed for
the intracellular potential to reach 63% of its highest level.
b) Low-pass filtering (see Fig. 8) This phenomenon is used to allow that fast and short
term signals are decreased and that intense (slow and long) signals can be
transmitted = filtering of low-pass signals. Graph: low-pass filtering. Low stimulation
frequency: intracellular potential changes can be fully reproduced. High stimulation
frequency: individual stimulations are not reproduced any more and the intracellular
potential remains unchanged.
P4010711
PHYWE Systeme GmbH & Co. KG © All rights reserved
7
TEB
Neurobiology: The nerve cell
Fig. 7
Fig 8
EXCITATORY SYNAPSE (FIG. 9)
Internet search keywords: Depolarization, summation, temporal summation, spatial
summation, EPSP.
Set-up is as in "Intracellular potential and action potential“.
Software parameters are as in "membrane time constant and low-pass filtering“. Threshold
= 0.
a) Depolarization (see Fig. 10)
8
PHYWE Systeme GmbH & Co. KG © All rights reserved
P4010711
Neurobiology: The nerve cell
TEB
Stimulations via excitatory synapses depolarize the cell membrane of the intracellular
potential, i.e. the voltage gradient between inside and outside the nerve cell membrane
becomes less negative.
Graph: medium stimulus level. One stimulus. The intracellular potential builds up briefly
and degrades again, as shown in "membrane time constant and low-pass filtering“.
Fig. 9: Experimental set-up
P4010711
PHYWE Systeme GmbH & Co. KG © All rights reserved
9
TEB
Neurobiology: The nerve cell
Fig 10
b) Temporal summation (see Fig. 11)
Temporal summation makes use of the integrated loudspeaker of the operating unit
(acoustic monitor). The signal helps find the level of stimulus at which no acoustic signal is
emitted when pressing the stimulus button very briefly – calibrate carefully by turning the
stimulus knob counterclockwise and testing by pressing the button. Now, without changing
the level of stimulus again, press the button for a longer time. The acoustic signal will
again sound. Pressing the knob for a longer time is identical with multiple stimuli.
Graph: temporal summation: the stimulus is so low that no action action potential is
created. Only multiple stimuli create action potential. No significant increase of intracellular
potential.
c) Spatial summation
Spatial summation again makes use of the integrated loudspeaker of the operating unit
again. As in the previous experiment, the position of the stimulus knob is determined at
which no signal is emitted, i.e. no action potential is created. This is done for a second
stimulus channel which is connected to a second synapse (i.e. two white cables are now
required instead of one). Then both stimulus buttons are pressed at the same time,
creating action potentials.
d) Synaptic amplification by terminal branches
Again here, acoustic determination of action potentials. As in the two previous
experiments, the position of the stimulus knob is determined at which no signal is emitted,
i.e. no action potential is created. Then an additional cable (white) is attached to connect
the excitatory synapse, which is connected to the stimulus, with the second excitatory
synapse. This step is repeated again with the third excitatory synapse. Each time the signal
gets more pronounced.
10
PHYWE Systeme GmbH & Co. KG © All rights reserved
P4010711
Neurobiology: The nerve cell
TEB
Fig 11
e) Effect of slowly decreasing stimulus (see Fig. 12)
Decreasing stimulus leads to decrease of action potential frequency and reduction of
depolarisation.
Left measurement: maximum stimulus S frequency of action potential high and
hyperpolarized intracellular potential.
Right measurement: stimulus is reduced S frequency of action potential and intracellular
potential back to normal.
Fig 12
P4010711
PHYWE Systeme GmbH & Co. KG © All rights reserved
11
TEB
Neurobiology: The nerve cell
HEBBIAN SYNAPSE (FIG. 13)
Internet search keywords: Hebbian synapse, synaptic learning, synaptic plasticity.
Fig 13: Experimental set-up
Synaptic learning and forgetting (see Fig. 14)
In the anatomical sample the Hebbian synapse is located at the end of dendritic spines. It
is an excitatory synapse with variable transmission behaviour.
To perform the experiment, turn threshold button to left (0) and turn stimulus buttons of
channels 1 and 2 to 75%. The first 6 spikes in the graph show: consecutive activation of
the Hebbian and excitatory synapses.
The next 12 spikes are created by simultaneous activation of the Hebbian and excitatory
synapses and increase of depolarization.
12
PHYWE Systeme GmbH & Co. KG © All rights reserved
P4010711
Neurobiology: The nerve cell
TEB
The next 3 spikes show activation of the Hebbian synapse which is now above the level of
initial activation.
The last 2 spikes show activation of the Hebbian synapse after pressing the reset button to
initiate synaptic forgetting: the Hebbian synapse has unlearnt the properties which it learnt
when coupled with an excitatory synapse. Longterm potentation: activation of Hebbian
synapse by complementary excitatory synapse can last several minutes up to several
hours. In the Neurosimulator activation lasts about 10 minutes, unless the reset button is
pressed.
Fig. 14
INHIBITORY SYNAPSE (FIG. 15)
Internet search keywords: IPSP, hyperpolarization.
P4010711
PHYWE Systeme GmbH & Co. KG © All rights reserved
13
TEB
Neurobiology: The nerve cell
Fig. 15: Experimental set-up
In the anatomical sample the location of the inhibitory synapse is in the shaft of the
dendrite of a nerve cell. Effect similar to excitatory synapses, however, its effect is inverse:
the negative polarisation of the intracellular potential increases further (> 70 mV) =
hyperpolarization = reduced excitation.
For the two experiments, wire stimulation channels 1 and 3 with the two inhibitory
synapses and stimulation channel 2 with one excitatory synapse.
a) Hyperpolarization (see Fig. 16)
Graph: activation of stimulation channel 1 (which is connected to an inhibitory synapse).
Hyperpolarization. Thereafter return to resting potential.
14
PHYWE Systeme GmbH & Co. KG © All rights reserved
P4010711
Neurobiology: The nerve cell
TEB
b) Spacial inhibitory-excitatory summation (see Fig. 17)
Sequential activation of all three stimulation channels to demonstrate spacial inhibition. At
first activation of the excitatory synapse (depolarization), thereafter inhibition in two steps,
by activating at first one, then the second inhibitory synapse. Keep buttons pressed.
Setting up the experiment: medium setting for stimulation channels 1 and 3, maximum
setting for stimulation channel 2 (which is connected to the excitatory synapse). Yellow
cable which connects to computer interface must be plugged into stimulation channel 2.
Fig. 16
Fig 17
P4010711
PHYWE Systeme GmbH & Co. KG © All rights reserved
15
TEB
Neurobiology: The nerve cell
VETO SYNAPSE (SEE FIG. 18)
Internet search keywords: Veto synapse.
The veto synapse does not bring about a change of the intracellular potential (so-called
silent inhibition). Its effect is only on the excitatory synapse to which it is attached (socalled presynaptic inhibition or shunting inhibition). No spatial summation.
Experimental setup: Connect stimulation channel 1 to excitatory synapse and stimulation
channel 2 to veto synapse. The stimulation channel for the veto synapse is connected to
the interface to show in the graph when the veto synapse is stimulated.
Graph: threefold activation of the veto synapse while the excitatory synapse is continuously
stimulated (Fig. 19).
Fig 18: Experimental set-up
16
PHYWE Systeme GmbH & Co. KG © All rights reserved
P4010711
Neurobiology: The nerve cell
TEB
Fig. 19
P4010711
PHYWE Systeme GmbH & Co. KG © All rights reserved
17


