FLIR Technical Series
Application Note for Research & Science
NDT in Composite Materials
with Flash, Transient, and Lockin Thermography
Markus Tarin and Ralph Rotolante
MoviTHERM, Inc.
Abstract
Composites are now used in everything from aircraft to prosthetics.
This paper will discuss three thermographic NDT techniques currently in
use for the detection and measurement of defects in composites such
as impact damage, delamination, voids, inclusions, and stresses. The
particular technique that should be employed for optimum results, whether
pulsed flash, pulsed transient, or lock-in, will depend upon the sample
material and thickness, and the test environment. Choice of camera type
also varies widely, from cooled to uncooled, with large format 640 × 480
pixels now available.
Introduction
Infrared cameras are used in a wide variety of military and civil
applications. These cameras typically operate with a temperature
sensitivity of about 15 mK for cooled and 80 mK for uncooled, certainly
sensitive enough for most applications.
Occasionally, and especially in many NDT applications, a more sensitive
measurement is needed. Infrared Pulse and Lock-In Thermography give a
much better sensitivity—100 times to 1000 times better.
Pulse and Lock-In Thermography are in use for NDT applications worldwide:
for defect imaging, stress imaging, solar-cell shunt imaging, solar-cell
carrier-density/lifetime imaging, and semiconductor photo- and electroluminescence imaging.
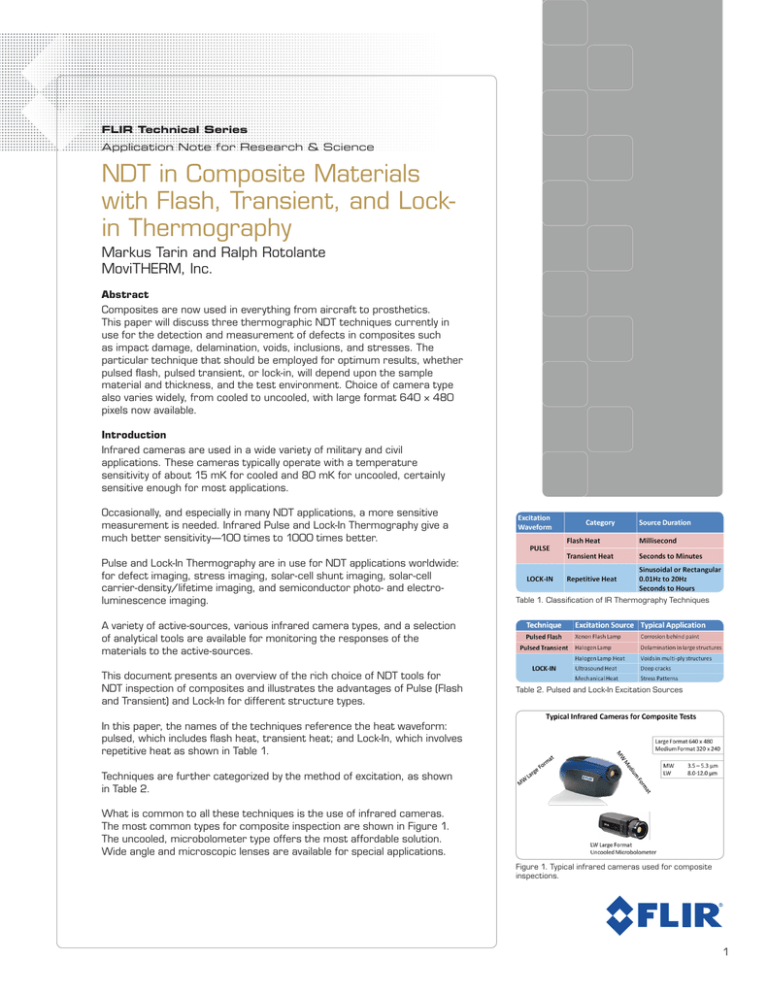
Table 1. Classification of IR Thermography Techniques
A variety of active-sources, various infrared camera types, and a selection
of analytical tools are available for monitoring the responses of the
materials to the active-sources.
This document presents an overview of the rich choice of NDT tools for
NDT inspection of composites and illustrates the advantages of Pulse (Flash
and Transient) and Lock-In for different structure types.
Table 2. Pulsed and Lock-In Excitation Sources
In this paper, the names of the techniques reference the heat waveform:
pulsed, which includes flash heat, transient heat; and Lock-In, which involves
repetitive heat as shown in Table 1.
Techniques are further categorized by the method of excitation, as shown
in Table 2.
What is common to all these techniques is the use of infrared cameras.
The most common types for composite inspection are shown in Figure 1.
The uncooled, microbolometer type offers the most affordable solution.
Wide angle and microscopic lenses are available for special applications.
Figure 1. Typical infrared cameras used for composite
inspections.
1
Pulsed Thermography – Principles of Operation
In pulsed thermography, the stimulus is applied with a xenon flash lamp for
a flash pulse or with a halogen lamp in the transient case. In both cases,
the equipment set-up is as indicated in Figure 2.
Figure 2. Equipment set-up for Pulse Thermography—
Flash or Transient
Solving the Heat Conduction Equation tells us that the thermal propagation
time to the depth of 2 mm to a subsurface defect is about 40 ms in
aluminum and for 2 mm of graphite epoxy is about 30s. This means Flash is
better for materials of high thermal diffusivity, e.g., metals. Materials with
a low thermal diffusivity, e.g., composites, have a long thermal propagation
time, which limits flash thermography to the detection of shallow defects.
The Heat Conduction Equation gives us the curve fit in Figure 3 for the
surface temperature of a sample with a defect after a heat pulse.
A good treatment of the underlying mathematics is given by Maldague1.
Figure 3. Typical temperature signal of one pixel at the
surface of a part after applying a heat pulse.
The reconstructed profiles in black are from an analytic approximation
function. Common analytical functions that are used include a rootapproximation-model, an exponential-approximation-model, and a pulsephase calculation which performs a Fourier Transform of the recorded
signal and gives the phase spectrum as a function of the frequency. The
first and second derivatives of these curves often yield the best images.
The main advantages of the flash thermography are short measuring
times and the ability to perform depth-resolved inspections, providing
excellent performance for inspection of thin layers and for the detection
of shallow defects.
Figure 4. Transient is best for composite samples that
are large in area and/or thick.
The main disadvantages of flash thermography are a limited inspection
area due to the energy of the flash lamps, a depth range limited to shallow
defects, and a high-thermal loading on the sample.
The main advantages of transient thermography are that it is applicable for
large-area measurements, halogen lamps are affordable heat-sources, and
the low thermal load on the inspected component.
The main disadvantage of transient thermography is that it is not suited for
thick samples.
A rough rule-of-thumb for composite defect inspection is up to 3 mm for
flash thermography (see Shepard2), up to 6 mm for transient thermography
(and up to 12 mm for Lock-In thermography, discussed below). Of course,
many material and configuration variables are present, so each application
must be evaluated individually.
Figure 5. Flash thermography is well-suited for very thin
samples.
Pulsed Thermography – Examples
Flash thermography with a high-power xenon lamp is a powerful tool for
thin samples with shallow defects, such as corrosion under paint. Typical
lamps are 6 kJ with 2 ms pulses. A dramatic example is shown in Figure 5,
a helicopter panel with corrosion under the paint. This is a situation where
transient or lock-in thermography would not work.
Figure 6. Inspection of dashboards for voids.
Transient thermography becomes important for large structures, as shown
in the auto factory image in Figure 6. Depending upon the minimum defect
size to be investigated, sections of an airplane fuselage or an AWACS dome
as large as 4 ft by 6 ft, can be imaged in a single shot, as shown in Figure
7. Typical set-ups will have two to four halogen lamps (1 kW each), used
with a 10 sec pulse and a 20 sec cool-down.
Figure 7. AWACS dome showing (a) Photograph of the
dome and workstation technician (b) Phase image of
damaged region (not visually seen) (c) Normal region of
the dome.
2
Lock-In Thermography – Principles of Operation
In lock-in thermography, the dynamic stimulus can be applied from a wide
variety of sources. For composite inspection, this includes halogen lamps,
ultrasound, and mechanical stimulation. In all cases, the equipment setup is
as shown in Figure 8.
Mathematically, in the lock-in case, the recorded temperature information
is transformed into the frequency domain. In each pixel, the measured
temporal evolution of the temperature is Fourier-transformed for all images
of the recorded sequence. Phase and amplitude information are derived
and presented as an image.
Figure 8. Schematic of equipment setup for lock-in
measurements.
Advantages of the lock-in method include:
• The summation causes a noise-filtering which enhances the contrast in
the resulting images.
• Depth range for the phase information is twice that of the pulse mode,
~ 2µ with µ =. 2 K
ρC pω
•L
ock-in allows detection of thermal waves with a sensitivity of 100 to
1,000 greater than the best thermal camera – down to µ-Kelvin range.
• The phase image is insensitive to external effects, such as sunlight,
reflections, dirt, and emissivity differences – problems common to
conventional thermography.
• The phase information is insensitive to uneven distribution of the
applied heat.
• Large areas can be examined within a few minutes from a distance via
non-contact measurement.
• An un-cooled IR-camera is normally sufficient.
• Affordable heat sources are widely available (e.g. halogen lamps).
• Visualization of deeper defects is possible than with pulse thermography.
Figure 9. Example of the lock-in measurement principle
measurements.
Figure 9 shows the measuring principle, using CFRP material with a
sinusoidal excitation. The curves are the typical temperature signals at the
surface. Curves are shown for pixels with and without delamination. Note
that the signal is evident in both amplitude and phase.
Lock-In Thermography – Examples
The most common excitation source for lock-in is the affordable halogen
lamp. Figure10 shows an example of voids in a new composite honeycomb.
Other defects like delaminations or inclusions also can be detected reliably
with lock-in.
Figure 10. Voids in composite Al-honeycomb structure.
This challenging measurement of Figure 10 was done at a frequency of
0.05 Hz, and for two periods - a forty second measurement acceptable for
many applications. The panel is 1-inch thick with defects on the front and
back sides.
An important source of heat is ultrasound. Typical settings are 100 W at
20 KHz with a 200 ms burst frequency for synchronization. A disadvantage
of the ultrasound technique is that it can be destructive—care is required
in the temperature rise.
Figure 11 shows a test of Carbon-fiber Reinforced Ceramic (CFRC) with
cracks originating from drilled holes.
A powerful tool for laboratory and factory is the use of mechanical excitation
for heat generation through the thermoelastic effect, shown in Figure 12.
Applications of this technique include measurement of fatigue limits,
imaging of stress patterns, crack propagation studies, and imaging of
Figure 11. Top: Visible image. Bottom: Phase image.
Fine cracks originating from the drilled holes are clearly
evident.
3
Figure 12. Compression and expansion give temperature
changes proportional to the stress.
Figure 14. Stress patterns on a polymer sample.
vibration patterns, as shown with turbine blades in Figure 13. The stress
images of Figure 13 are equivalent to having 320 x 240 = 77,000 strain
gages on the sample. Engineers often compare results such as these to
FEA calculations.
Figure 15. Time, power, and temperature regimes for
pulsed flash, pulsed transient and lock-in.
Polymers present a challenge for thermography because they are often
orientation-dependent, as shown in Figure 14. The different thermal
characteristics of the fibers are evident in the figure. Features of 1 mm
size are evident. A standard microscope lens could be used with this FLIR
MW camera to examine detail as small as 5 µm.
Summary
It is evident from the discussion above that pulsed flash, pulsed transient
and lock-in thermography are important tools for research and for quality
assurance in most areas of manufacturing. The particular technique used
must be determined on a case-by-case basis. A starting point for the
choice is shown in Figure 15 - do you need a blink…a glance…or a stare.
717 Hz – 1st Mode
References
1.X. Maldague, Theory and Practice of Infrared Technology for
Nondestructive Testing, John Wiley & Sons, 2001.
2.S. Shepard, “Understanding Flash Thermography,” Materials Evaluation,
454 (2006).
About the Authors
2136 Hz – 2nd Mode
Markus Tarin is President and CEO of MoviTHERM.
Ralph Rotolante heads the East Coast Operations of MoviTHERM
BOSTON
FLIR Systems, Inc.
25 Esquire Road
North Billerica, MA 01862
USA
PH: +1 866.477.3687
PH: +1 978.901.8000
PORTLAND
Corporate Headquarters
FLIR Systems, Inc.
27700 SW Parkway Ave.
Wilsonville, OR 97070
USA
PH: +1 866.477.3687
CANADA
MEXICO/LATIN AMERICA
FLIR Systems, Ltd.
920 Sheldon Ct.
Burlington, ON L7L 5L6
Canada
PH: +1 800.613.0507
FLIR Systems Brasil
Av. Antonio Bardella
320 - B. Boa Vista- Cep:
18085–852 - Sorocaba – SP - Brazil
PH: +55 15 3238 8070
©2011 FLIR Systems, Inc. All rights reserved. (Rev. 8/11)
www.flir.com
NASDAQ: FLIR
3418 Hz – 3rd Mode
5911 Hz – 4th Mode
Tests performed on shake table.
Figure 13. Vibration mode on a turbine blade tested on
a shake table.
4

