Summary of GDB commands for x86
advertisement

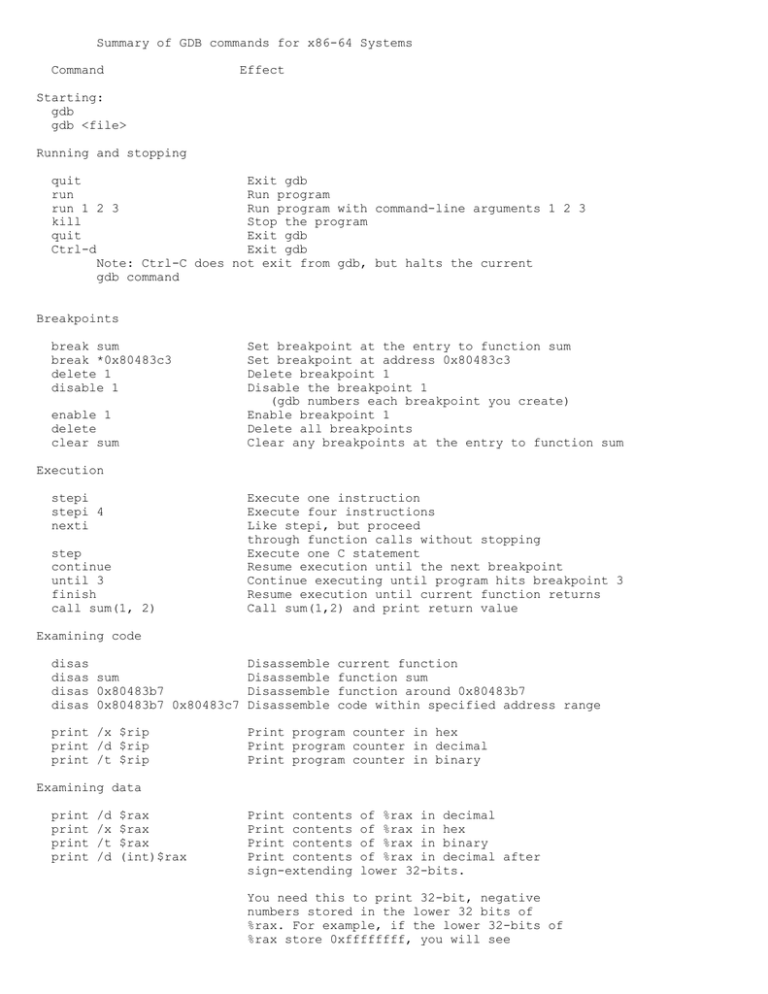
Summary of GDB commands for x86-64 Systems Command Effect Starting: gdb gdb <file> Running and stopping quit Exit gdb run Run program run 1 2 3 Run program with command-line arguments 1 2 3 kill Stop the program quit Exit gdb Ctrl-d Exit gdb Note: Ctrl-C does not exit from gdb, but halts the current gdb command Breakpoints break sum break *0x80483c3 delete 1 disable 1 enable 1 delete clear sum Set breakpoint at the entry to function sum Set breakpoint at address 0x80483c3 Delete breakpoint 1 Disable the breakpoint 1 (gdb numbers each breakpoint you create) Enable breakpoint 1 Delete all breakpoints Clear any breakpoints at the entry to function sum Execution stepi stepi 4 nexti step continue until 3 finish call sum(1, 2) Execute one instruction Execute four instructions Like stepi, but proceed through function calls without stopping Execute one C statement Resume execution until the next breakpoint Continue executing until program hits breakpoint 3 Resume execution until current function returns Call sum(1,2) and print return value Examining code disas disas sum disas 0x80483b7 disas 0x80483b7 0x80483c7 Disassemble Disassemble Disassemble Disassemble current function function sum function around 0x80483b7 code within specified address range print /x $rip print /d $rip print /t $rip Print program counter in hex Print program counter in decimal Print program counter in binary Examining data print print print print /d /x /t /d $rax $rax $rax (int)$rax Print contents Print contents Print contents Print contents sign-extending of %rax in decimal of %rax in hex of %rax in binary of %rax in decimal after lower 32-bits. You need this to print 32-bit, negative numbers stored in the lower 32 bits of %rax. For example, if the lower 32-bits of %rax store 0xffffffff, you will see (gdb) print $rax $1 = 4294967295 (gdb) print (int)$rax $2 = -1 (gdb) print print print print print print 0x100 /x 555 /x ($rsp+8) *(int *) 0xbffff890 *(int *) ($rsp+8) (char *) 0xbfff890 Print decimal representation of 0x100 Print hex representation of 555 Print (contents of %rsp) + 8 in hex Print integer at address 0xbffff890 Print integer at address %rsp + 8 Examine a string stored at 0xbffff890 x/w 0xbffff890 x/w x/wd $rsp $rsp x/2w $rsp Examine (4-byte) word starting at address 0xbffff890 Examine (4-byte) word starting at address in $rsp Examine (4-byte) word starting at address in $rsp. Print in decimal Examine two (4-byte) words starting at address in $rsp Examine two (4-byte) words starting at address in $rsp. Print in decimal Examine (8-byte) word starting at address in $rsp. Examine (8-byte) word starting at address in $rsp. Print in decimal Examine address in $rsp. Print as offset from previous global symbol. Examine a string stored at 0xbffff890 Examine first 20 opcode bytes of function sum Examine first 10 instructions of function sum x/2wd $rsp x/g x/gd $rsp $rsp x/a $rsp x/s 0xbffff890 x/20b sum x/10i sum (Note: the format string for the ‘x’ command has the general form x/[NUM][SIZE][FORMAT] where NUM = number of objects to display SIZE = size of each object (b=byte, h=half-word, w=word, g=giant (quad-word)) FORMAT = how to display each object (d=decimal, x=hex, o=octal, etc.) If you don’t specify SIZE or FORMAT, either a default value, or the last value you specified in a previous ‘print’ or ‘x’ command is used. ) Useful information backtrace where Print the current address and stack backtrace Print the current address and stack backtrace info info info info info info Print Print Print Print Print Print program functions stack frame registers breakpoints display /FMT EXPR undisplay help current status of the program) functions in program backtrace of the stack) information about the current stack frame registers and their contents status of user-settable breakpoints Print expression EXPR using format FMT every time GDB stops Turn off display mode Get information about gdb


