Project Simulation
advertisement
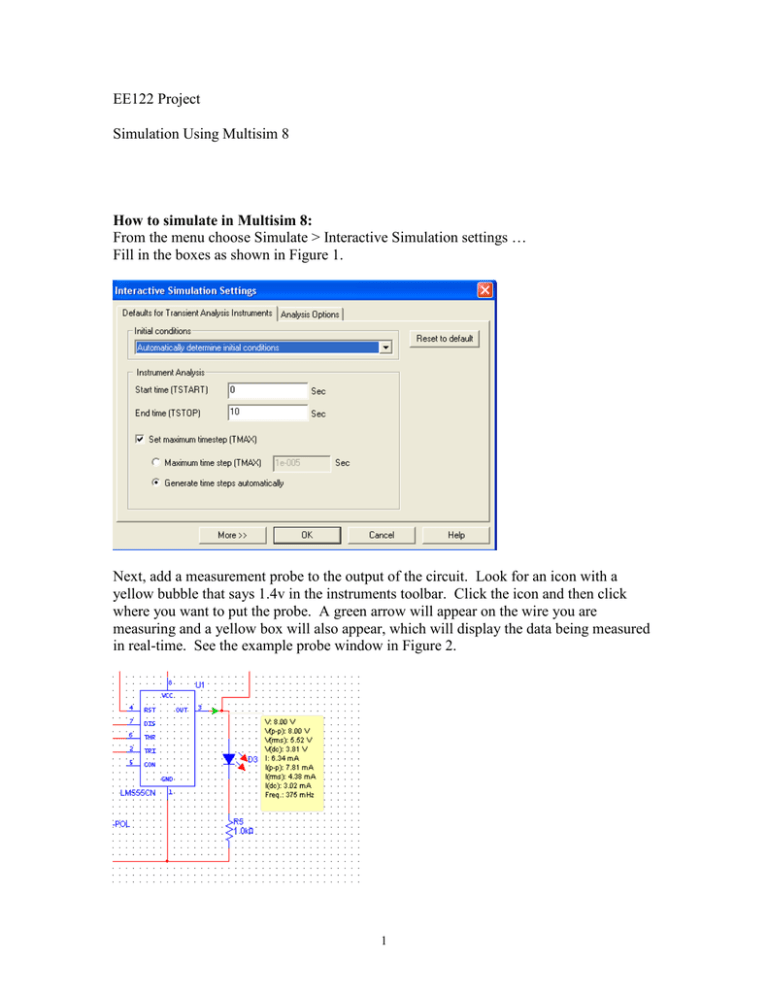
EE122 Project Simulation Using Multisim 8 How to simulate in Multisim 8: From the menu choose Simulate > Interactive Simulation settings … Fill in the boxes as shown in Figure 1. Next, add a measurement probe to the output of the circuit. Look for an icon with a yellow bubble that says 1.4v in the instruments toolbar. Click the icon and then click where you want to put the probe. A green arrow will appear on the wire you are measuring and a yellow box will also appear, which will display the data being measured in real-time. See the example probe window in Figure 2. 1 Next, add an oscilloscope to observe the input switch and output pulse vs. time. Connect port A of the oscilloscope to pin 2 of the 555 Timer and port B to pin 3. An example of a 4-port oscilloscope is given in Figure 3. To observe the circuit’s function in real time you must turn on the power or simulate the circuit. To turn on the power, click on the power switch in the toolbar. To run the simulation for the time we specified in Figure 1, click on the lightning bolt in the toolbar. See Figure 4. Once either of the buttons is pressed, the measurement probe box will begin to fill will values. To watch the oscilloscope output, just double click on it. Once the 10 seconds are up, the simulation will stop. 2 Working with the circuit in real time: Simulate button After the power button is clicked the user must simulate the push-button or switch action. To do this, press the key that is named by the part. For example, next to a NO pushbutton says Key = Space thus, the space bar must be pressed to make the action occur. To change the key, double click on the component and change the key for switch value under the Value tab. Notice that while the simulation is running the LED arrows will light up in the color specified. Power switch Now that the simulation is complete you need to analyze the results. To look at the complete oscilloscope output for the 10 second simulation, go to View > Grapher. A new window will open showing the oscilloscope channel on the Y axis and time on the X axis. However, data for all channels is present in the graph. Click on a waveform, notice in the bottom left hand corner which is the selected trace. To differentiate between channels, right click on one of the waveforms and choose trace properties. In the pop-up window, click on the tab named Trace and pick a different color. To only look at one waveform, right click on the trace you do not want to see and choose hide. Figure 5 shows example output for two channels of an oscilloscope. The Blue waveform is the input and the red waveform is the output. The values in Grapher can be exported to excel by clicking on the excel export button. 3 Export data to excel button 4
