© 2010 Nature America, Inc. All rights reserved.
correspondEnce
tions (omitting the time stamps). We used interventional data on
steady-state gene expression levels of known single-gene knockout experiments as the gold standard for determining the causal
effects. We applied IDA, as well as Lasso and Elastic-net, to the
observational datasets and evaluated how well the resulting top q
predicted effects (q = 10 for the networks of size 10 and q = 25 for
the networks of size 100) corresponded to the top m percentage
(m = 5 or 10) of the effects as computed from the interventional
data (Supplementary Methods). We counted the number of
networks in which the partial area under the receiver operating
characteristic curve (pAUC) was better than random guessing at
significance level a = 0.01 for both values of m (Supplementary
Methods). By this measure, IDA was at least as good as Lasso
and Elastic-net for all four possible combinations of the type of
observational data (multifactorial or time series) and the size of
the networks (10 or 100 genes). The difference was largest for the
multifactorial data on the networks of size 10, where IDA was
substantially better than Lasso and Elastic-net for three of the
five networks (Supplementary Fig. 1 and Supplementary Table
2). For instance, in this setting with m = 10 and q = 10, IDA
found 4, 4, 5, 1 and 2 true positives for the five different networks,
whereas Lasso found 1, 1, 0, 1 and 2 true positives and Elastic-net
found 3, 1, 0, 1 and 1 true positives.
The results presented here on S. cerevisiae and the DREAM4
data are proof-of-concept results that IDA can predict the strongest causal effects in potentially large-scale biological systems
by using only observational data. In particular, the results on
S. cerevisiae demonstrate that we were able to do this in a challenging real-world setting where the number of variables (5,361)
was much larger than the sample size (63) and the variables were
substantially disturbed by noise. As IDA is supported by mathematical theory, we expect the results presented here to generalize
to other problems.
Of course, statistical predictions based on observational data
can never replace intervention experiments. In fact, whenever
possible, IDA predictions should be followed up by intervention
experiments. In this way, the predictions can serve as a new tool
for the design of experiments, as they indicate which interventions are likely to show a large effect.
Software for IDA is available in the open source R-package
pcalg (http://cran.r-project.org/web/packages/pcalg/index.
html).
Note: Supplementary information is available on the Nature Methods website.
COMPETING FINANCIAL INTERESTS
The authors declare no competing financial interests.
Marloes H Maathuis1, Diego Colombo1, Markus Kalisch1 &
Peter Bühlmann1,2
Seminar for Statistics, Department of Mathematics, Eidgenössische Technische
Hochschule (ETH) Zurich, Zurich, Switzerland. 2Competence Center for
Systems Physiology and Metabolic Diseases, Zurich, Switzerland.
e-mail: maathuis@stat.math.ethz.ch
1. Pearl, J. Causality: Models, Reasoning, and Inference. (Cambridge Univ.
Press, Cambridge, UK, 2000).
2. Maathuis, M.H., Kalisch, M. & Bühlmann, P. Ann. Stat. 37, 3133–3164
(2009).
3. Hughes, T.R. et al. Cell 102, 109–126 (2000).
4. Tibshirani, R. J. Roy. Statist. Soc. Ser. B 58, 267–288 (1996).
5. Zou, H. & Hastie, T. J. Roy. Statist. Soc. Ser. B 67, 301–320 (2005).
6. Marbach, D., Schaffter, T., Mattiussi, C. & Floreano, D. J. Comp. Biol. 16
229–239 (2009).
248 | VOL.7 NO.4 | APRIL 2010 | nature methods
A method and server for predicting
damaging missense mutations
To the Editor: Applications of rapidly advancing sequencing
technology exacerbate the need to interpret individual sequence
variants. Sequencing of phenotyped clinical subjects will soon
become a method of choice in studies of the genetic causes of
Mendelian and complex diseases. New exon-capture techniques
will direct sequencing efforts to the most informative and easily
interpretable protein-coding fraction of the genome. Thus, the
demand for computational predictions of the impact of protein
sequence variants will continue to grow.
Here we present a new method and the corresponding software tool, PolyPhen-2 (http://genetics.bwh.harvard.edu/pph2/,
Supplementary Software), for predicting damaging effects of
missense mutations. PolyPhen-2 is different from the earlier
tool PolyPhen1 in the set of predictive features, the alignment
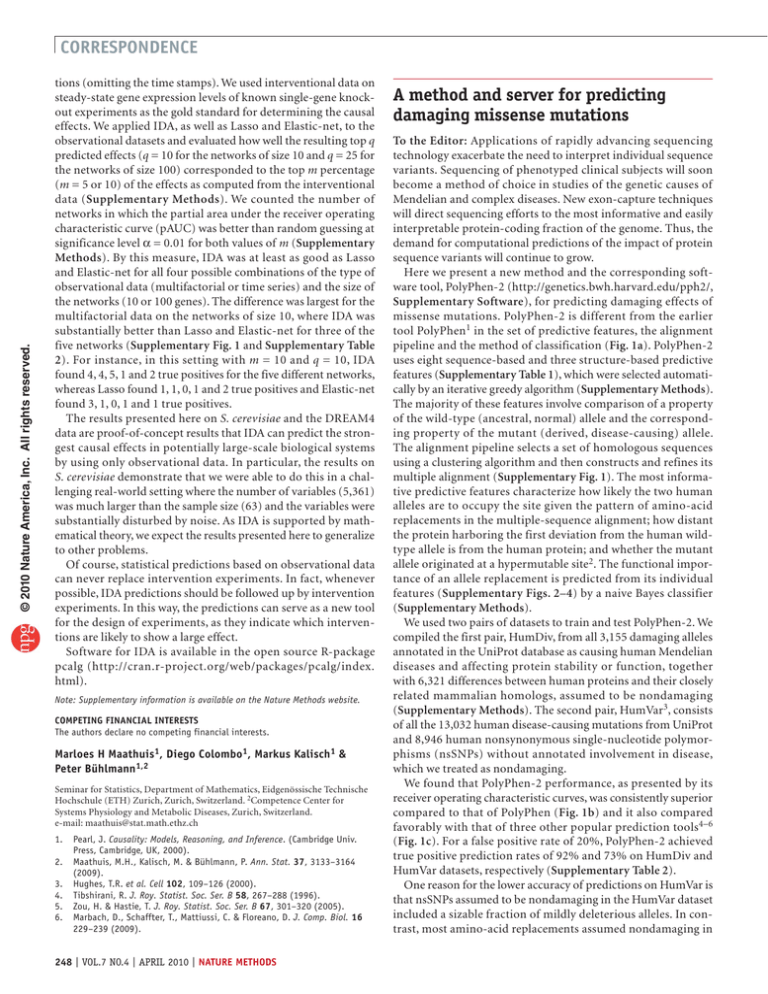
pipeline and the method of classification (Fig. 1a). PolyPhen-2
uses eight sequence-based and three structure-based predictive
features (Supplementary Table 1), which were selected automatically by an iterative greedy algorithm (Supplementary Methods).
The majority of these features involve comparison of a property
of the wild-type (ancestral, normal) allele and the corresponding property of the mutant (derived, disease-causing) allele.
The alignment pipeline selects a set of homologous sequences
using a clustering algorithm and then constructs and refines its
multiple alignment (Supplementary Fig. 1). The most informative predictive features characterize how likely the two human
alleles are to occupy the site given the pattern of amino-acid
replacements in the multiple-sequence alignment; how distant
the protein harboring the first deviation from the human wildtype allele is from the human protein; and whether the mutant
allele originated at a hypermutable site2. The functional importance of an allele replacement is predicted from its individual
features (Supplementary Figs. 2–4) by a naive Bayes classifier
(Supplementary Methods).
We used two pairs of datasets to train and test PolyPhen-2. We
compiled the first pair, HumDiv, from all 3,155 damaging alleles
annotated in the UniProt database as causing human Mendelian
diseases and affecting protein stability or function, together
with 6,321 differences between human proteins and their closely
related mammalian homologs, assumed to be nondamaging
(Supplementary Methods). The second pair, HumVar3, consists
of all the 13,032 human disease-causing mutations from UniProt
and 8,946 human nonsynonymous single-nucleotide polymorphisms (nsSNPs) without annotated involvement in disease,
which we treated as nondamaging.
We found that PolyPhen-2 performance, as presented by its
receiver operating characteristic curves, was consistently superior
compared to that of PolyPhen (Fig. 1b) and it also compared
favorably with that of three other popular prediction tools4–6
(Fig. 1c). For a false positive rate of 20%, PolyPhen-2 achieved
true positive prediction rates of 92% and 73% on HumDiv and
HumVar datasets, respectively (Supplementary Table 2).
One reason for the lower accuracy of predictions on HumVar is
that nsSNPs assumed to be nondamaging in the HumVar dataset
included a sizable fraction of mildly deleterious alleles. In contrast, most amino-acid replacements assumed nondamaging in
correspondEnce
a
Input
Analysis
Prediction
Interpretation
Sequence
nsSNP
MSA creation
Homology search,
raw multiple sequence
alignment,
alignment improvement,
alignment clustering,
alignment refinement
MSA
Profile-based scores
Identity-based scores
Annotation
ACT_SITE 66, 110, 203
MSA depth, CpG context
Pfam domain, residue volume
Prediction confidence
Probabilistic
classifier
3D visualization
Structure
Accessible surface area,
hydrophobic propensity,
B-factor
c
1.0
1.0
0.8
0.8
True positive rate
True positive rate
© 2010 Nature America, Inc. All rights reserved.
b
0.6
0.4
0.6
0.4
0.2
0.2
0
0
0
0.2
0.4
0.6
0.8
False positive rate
1.0
PolyPhen-2, HumDiv versus UniRef100
PolyPhen-2, HumDiv versus Swiss-Prot
PolyPhen-2, HumVar versus UniRef100
PolyPhen-2, HumVar versus Swiss-Prot
PolyPhen PSIC, HumDiv versus UniRef100
PolyPhen PSIC, HumDiv versus Swiss-Prot
PolyPhen PSIC, HumVar versus UniRef100
PolyPhen PSIC, HumVar versus Swiss-Prot
0
0.2
0.4
0.6
0.8
False positive rate
1.0
PolyPhen-2, HumVar* versus UniRef100
PolyPhen-2, HumVar* versus Swiss-Prot
SIFT, HumVar versus Swiss-Prot
SNAP, HumVar
SNPs3D, HumVar
*HumDiv proteins excluded
the HumDiv dataset must be close to selective neutrality. Because
alleles that are mildly but unconditionally deleterious may not
be fixed in the evolving lineage, no method based on comparative sequence analysis is ideal for discriminating between drastically and mildly deleterious mutations, which were assigned to
opposite categories in HumVar data. Another reason is that the
HumDiv dataset uses extra criteria (Supplementary Methods) to
avoid possible erroneous annotations of damaging mutations.
PolyPhen-2 calculates the naive Bayes posterior probability
that a given mutation is damaging and reports estimates of false
positive (the chance that the mutation is classified as damaging
when it is in fact nondamaging) and true positive (the chance that
the mutation is classified as damaging when it is indeed damaging) rates. A mutation is also appraised qualitatively, as benign,
possibly damaging or probably damaging (Supplementary
Methods).
The user can choose between HumDiv- and HumVar-trained
PolyPhen-2. Diagnostics of Mendelian diseases require distinguishing mutations with drastic effects from other human
variation, including abundant mildly deleterious alleles. Thus,
HumVar-trained PolyPhen-2 should be used for this task. In contrast, HumDiv-trained PolyPhen-2 should be used to evaluate
rare alleles at loci potentially involved in complex phenotypes,
for dense mapping of regions identified by genome-wide association studies and for analysis of natural selection from sequence
Figure 1 | PolyPhen-2 pipeline and prediction
accuracy. (a) Overview of the algorithm. MSA,
multiple sequence alignment. (b) Receiver
operating characteristic (ROC) curves for
predictions made by PolyPhen-2 using fivefold
cross-validation on HumDiv and HumVar3 data,
using UniRef100 and Swiss‑Prot databases for
the homology search. Also shown are ROC curves
for PolyPhen on HumDiv and HumVar calculated
from the difference between position-specific
independent counts (PSIC) scores1 of the wildtype and the mutant amino acids. (c) ROC curves
for PolyPhen-2 trained on HumDiv and tested
on a subset of HumVar data nonoverlapping
with HumDiv data. UniRef100 and Swiss‑Prot
databases were used for the homology search.
Also shown are ROC curves obtained using the
programs sorting intolerant from tolerant (SIFT)4,
screening for nonacceptable polymorphisms
(SNAP)5 and SNPs3D6 on HumVar data. Methods
other than PolyPhen‑2 and PolyPhen could not
easily be applied to HumDiv data because using
the same sequences for obtaining both multiple
alignments and nondamaging replacements
must be avoided. SIFT was used in conjunction
with Swiss-Prot database, SNAP and SNPs3D
were used with their corresponding default
databases. We used SIFT with Swiss‑Prot database
for homology search since Swiss‑Prot does not
contain sequences of splice forms, sequences of
human allelic variants and incomplete sequences,
making it possible to guarantee that allelic
variants used in testing datasets would not
appear in multiple-sequence alignments.
data, in which even mildly deleterious alleles must be treated as
damaging.
Note: Supplementary information is available on the Nature Methods website.
ACKNOWLEDGMENTS
We thank Y. Bromberg for help with the SNAP analysis. V.E.R. acknowledges
support by the Russian Academy of Sciences Program in Molecular and Cellular
Biology. This work was supported by the US National Institutes of Health (R01
GM078598 and in part by R01 MH084676).
COMPETING FINANCIAL INTERESTS
The authors declare no competing financial interests.
Ivan A Adzhubei1,7, Steffen Schmidt2,7, Leonid Peshkin3,7,
Vasily E Ramensky4, Anna Gerasimova5, Peer Bork6,
Alexey S Kondrashov5 & Shamil R Sunyaev1
1Division of Genetics, Brigham & Women’s Hospital, Harvard Medical School,
Boston, Massachusetts, USA. 2Department of Biochemistry, Max Planck Institute
for Developmental Biology, Tübingen, Germany. 3Department of Systems Biology,
Harvard Medical School, Boston, Massachusetts, USA. 4Engelhardt Institute of
Molecular Biology, Russian Academy of Sciences, Moscow, Russia. 5Life Sciences
Institute and Department of Ecology and Evolutionary Biology, University of
Michigan, Ann Arbor, USA. 6European Molecular Biology Laboratory, Heidelberg,
Germany. 7These authors contributed equally to this work.
e-mail: ssunyaev@rics.bwh.harvard.edu
1.
2.
3.
4.
5.
6.
Ramensky, V., Bork, P. & Sunyaev, S. Nucleic Acids Res. 30, 3894–3900 (2002).
Schmidt, S. et al. PLoS Genet. 4, e1000281 (2008).
Capriotti, E., Calabrese, R. & Casadio, R. Bioinformatics 22, 2729–2734 (2006).
Ng, P.C. & Henikoff, S. Nucleic Acids Res. 31, 3812–3814 (2003).
Bromberg, Y., Yachdav, G. & Rost, B. Bioinformatics 24, 2397–2398 (2008).
Yue, P., Melamud, E. & Moult, J. BMC Bioinformatics 7, 166 (2006).
nature methods | VOL.7 NO.4 | APRIL 2010 | 249


