Name
Chapter 17, Lesson 2
Reteach
Date
Interpret Graphs of Ordered Pairs
CA Standards
SDAP 1.4, AF 1.1
Points can be plotted on a coordinate grid using ordered pairs. Each
ordered pair is named by (x, y).
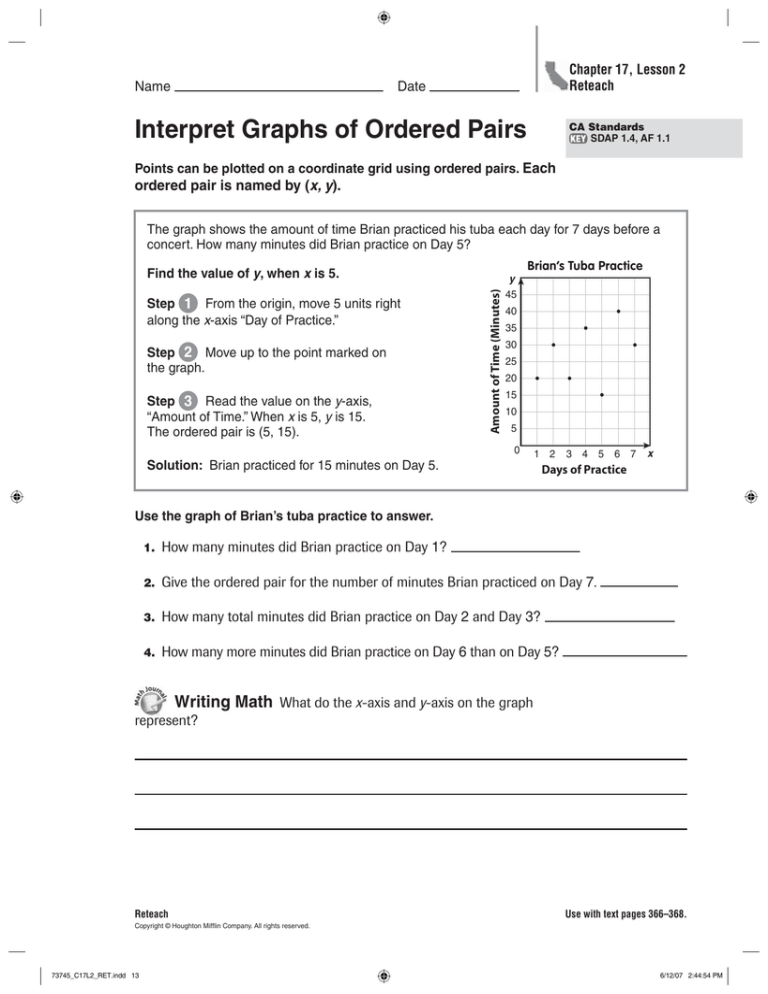
The graph shows the amount of time Brian practiced his tuba each day for 7 days before a
concert. How many minutes did Brian practice on Day 5?
Brian’s Tuba Practice
Step 1 From the origin, move 5 units right
along the x-axis “Day of Practice.”
Step 2 Move up to the point marked on
the graph.
Step 3 Read the value on the y-axis,
“Amount of Time.” When x is 5, y is 15.
The ordered pair is (5, 15).
Amount of Time (Minutes)
Find the value of y, when x is 5.
y
45
40
35
30
25
20
15
10
5
0
1
Solution: Brian practiced for 15 minutes on Day 5.
2
3
4
5
6
7
x
Days of Practice
Use the graph of Brian’s tuba practice to answer.
1.
How many minutes did Brian practice on Day 1?
2.
Give the ordered pair for the number of minutes Brian practiced on Day 7.
3.
How many total minutes did Brian practice on Day 2 and Day 3?
4.
How many more minutes did Brian practice on Day 6 than on Day 5?
Writing Math What do the x-axis and y-axis on the graph
represent?
Reteach
Use with text pages 366–368.
Copyright © Houghton Mifflin Company. All rights reserved.
73745_C17L2_RET.indd 13
6/12/07 2:44:54 PM


