Abnormal Traffic Detection Using Intelligent Driver Model
advertisement

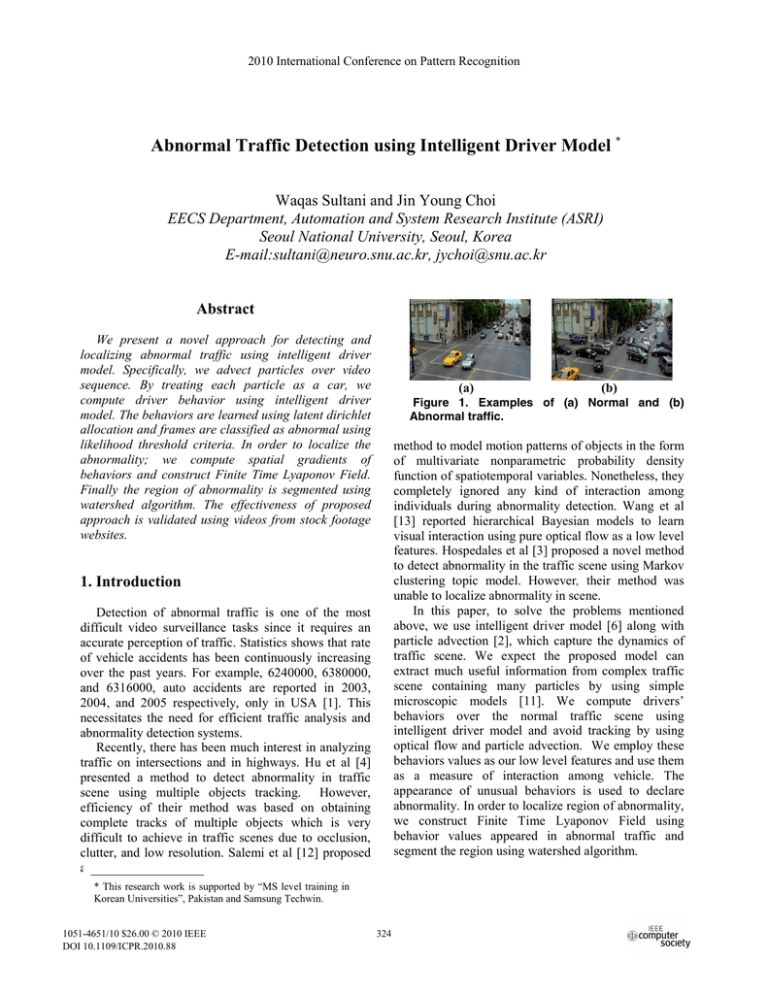
2010 International Conference on Pattern Recognition Abnormal Traffic Detection using Intelligent Driver Model * Waqas Sultani and Jin Young Choi EECS Department, Automation and System Research Institute (ASRI) Seoul National University, Seoul, Korea E-mail:sultani@neuro.snu.ac.kr, jychoi@snu.ac.kr Abstract We present a novel approach for detecting and localizing abnormal traffic using intelligent driver model. Specifically, we advect particles over video sequence. By treating each particle as a car, we compute driver behavior using intelligent driver model. The behaviors are learned using latent dirichlet allocation and frames are classified as abnormal using likelihood threshold criteria. In order to localize the abnormality; we compute spatial gradients of behaviors and construct Finite Time Lyaponov Field. Finally the region of abnormality is segmented using watershed algorithm. The effectiveness of proposed approach is validated using videos from stock footage websites. (a) method to model motion patterns of objects in the form of multivariate nonparametric probability density function of spatiotemporal variables. Nonetheless, they completely ignored any kind of interaction among individuals during abnormality detection. Wang et al [13] reported hierarchical Bayesian models to learn visual interaction using pure optical flow as a low level features. Hospedales et al [3] proposed a novel method to detect abnormality in the traffic scene using Markov clustering topic model. However, their method was unable to localize abnormality in scene. In this paper, to solve the problems mentioned above, we use intelligent driver model [6] along with particle advection [2], which capture the dynamics of traffic scene. We expect the proposed model can extract much useful information from complex traffic scene containing many particles by using simple microscopic models [11]. We compute drivers’ behaviors over the normal traffic scene using intelligent driver model and avoid tracking by using optical flow and particle advection. We employ these behaviors values as our low level features and use them as a measure of interaction among vehicle. The appearance of unusual behaviors is used to declare abnormality. In order to localize region of abnormality, we construct Finite Time Lyaponov Field using behavior values appeared in abnormal traffic and segment the region using watershed algorithm. 1. Introduction Detection of abnormal traffic is one of the most difficult video surveillance tasks since it requires an accurate perception of traffic. Statistics shows that rate of vehicle accidents has been continuously increasing over the past years. For example, 6240000, 6380000, and 6316000, auto accidents are reported in 2003, 2004, and 2005 respectively, only in USA [1]. This necessitates the need for efficient traffic analysis and abnormality detection systems. Recently, there has been much interest in analyzing traffic on intersections and in highways. Hu et al [4] presented a method to detect abnormality in traffic scene using multiple objects tracking. However, efficiency of their method was based on obtaining complete tracks of multiple objects which is very difficult to achieve in traffic scenes due to occlusion, clutter, and low resolution. Salemi et al [12] proposed a * This research work is supported by “MS level training in Korean Universities”, Pakistan and Samsung Techwin. 1051-4651/10 $26.00 © 2010 IEEE DOI 10.1109/ICPR.2010.88 (b) Figure 1. Examples of (a) Normal and (b) Abnormal traffic. 324 2. Intelligent Driver Model 3.1. Motion Estimation The intelligent driver model closely approximates driver behavior and incorporate reaction to velocity difference. It is fast, robust, accident free and reproduces empirically observed dynamics [7], [9]. There are mainly three types of traffic on roads i.e. free flow, synchronized and congested traffic [11]. Intelligent driver model is a novel and well established car following model that describes behaviors of driver for all three types of traffic. According to this model, each car changes its velocity depending on distance to and velocity of preceding car. On free roads, car will asymptotically reach its desired velocity by v dv δ , (1) = α [1 − ( ) ] Fast motion estimation is difficult problem to solve. In order to estimate motion, we employ phase correlation method and measure displacement between respective blocks, for every two frames, directly from their phases. We achieve spatial temporal average of flow field using separable convolution of 3D signal, i.e. flow field, with spatial gaussian kernel of variance ‘µs’ and temporal gaussian kernel of variance ‘µt’. 3.2. Particle advection The purpose of particle advection is to uncover the spatial organization of scene. We move grid of particles over spatial temporal average of optical flow calculated in last section. Note that in our formulation, we are assuming each particle to be representative of a car [11], [5], [9]. Trajectories of particles owing along velocity (flow) field are estimated using initial value problem method [2]. The equation formulation of particle advection method is given as follows (5) ( x 1n , y 1n ) = ( x 0n , y 0n ) + h × f ( x 0n , y 0n , t 0 ) , n n act n dt n act v des n des where v and v are actual and desired velocity of ‘nth’ vehicle respectively and ‘α’ and ‘δ’ are known prior. The calculation of actual and desired velocity will be explained in 3.2 When traffic is going to be synchronized, vehicles approach each other and driver tends to keep velocity dependent equilibrium distance given by dv n n S m in + v act ×T = −α × dt S act 2 , where ( x 0n , y 0n ) represents initial location of ‘nth’ particle, ‘h’ is step size and f ( x 0n , y 0n , t 0 ) is the value of velocity field at location ( x 0n , y 0n ) at time t0 . For each new time instant, we replace ( x 0n , y 0n ) by ( x1n , y 1n ) in above equation and repeat the process. This iterative process continues for each particle over whole video. After obtaining trajectories of all particles over whole video, we calculated resultant velocity of particles at each location along their path using spatial temporal averaged optical flow vectors. Since velocity of particles calculated in this step is dependent on velocities of neighboring particles, the situation is similar to motion of cars on road, whose velocity is highly dependent on the velocities of neighboring cars. Velocity calculated in this step is named as ‘actual velocities’. In next step, we calculated resultant velocity of particles at each location using actual optical flow vectors. The velocity calculated in this step is named as ‘desired velocity’ since it is not dependent on the velocities of neighboring particles. (2) where ‘ Smin’ is minimum distance between cars to avoid accident and ‘Sact’ is actual distance between cars and ‘T’ is safe time headway (sec). During congestion, driver behavior is governed by dv n dt = −( n n vact × Δ vact 2 × b × S act )2 , (3) n where ‘b’ is desired declaration and ‘ Δvact ’ is velocity of ‘nth’ car with respect to leading car. The generalized behavior of driver on roads is sum of all three above behaviors [6], [9], i.e. dvg n dt = α × [1 − ( + v n a ct 2× Δv v anct v dnes n a ct α ×b ) δ − [( S m in + v anc t × T (4) ) / S a c t ] 2 ]. It is important to mention here that models like ‘social force’ are inappropriate to capture traffic dynamics. This is because of significance differences between traffic dynamics and crowd flow despite of many similarities [6]. 3.3. Intelligent Driver Behavior Calculation Since in our formulation, we are treating each particle as a car, so we estimate intelligent driver behavior for each car using (4). These behaviors are calculated at each location along the path using desired and actual velocities calculated in previous section. To 3. Implementation In this section, we present algorithmic details involved in carrying out abnormal traffic detection. 325 4. Experiments and Discussion calculate relative velocity of particle at time‘t’, we subtract velocity of particle at time ‘t-1’ from velocity of particle at time ‘t’ i.e. n n n Δvact = vact − vact . (6) ,t ,t , t −1 In this section, we present our results for abnormality detection and localization on traffic videos taken from stock footage web sites. Other parameter values are chosen from [6]. These behaviors are representations of driver attitude in safe, stable, and accident free situation, i.e. normal traffic [9]. 4.1 Abnormality Detection In our experiments, we have used presence of unusual driver behavior as a measure of abnormality. For this purpose, we used normal traffic sequences and extracted intelligent driver behaviors. All frames were resized to 240×160.The resolution of particle was kept equal to frame size i.e. 240×160. For particle advection, we used step size ‘h’ of .1245 and measured actual and desired velocities of particles using bilinear interpolation. Intelligent driver behaviors (IDBs) over the video were calculated using the method described in section 3.3. Note that the IDM has well defined parameters that are easy to calibrate. We use the parameter values as suggested in [6]. In learning phase, we extracted every 5×5×10 pattern of driver behaviors values. We termed this pattern as a ‘word’. We learned vocabulary using thirty numbers of clusters. Documents size was kept at 10 frames. We discovered 20 latent topics and estimated parameters of our model using variation expectation maximization [8]. In testing phase, we calculated the likelihood of each document using parameters learned in learning phase. Documents with very low likelihood were classified as abnormal. Abnormality detection results for four different traffic scenarios are shown in figure 2. 3.4. Learning of Intelligent Driver Behaviors In this work, we model the given traffic scene using latent dirichlet allocation (LDA) [8] which is adopted from text processing literature. We extract M×N×F patterns of intelligent behaviors from the video sequence where M×N is the patch size and ‘T’ is the number of frames in one document. We learn vocabulary by K-mean clustering. The center of each cluster is defined as a word. The notion of documents is generated by dividing each video sequence in short clips. Thus, each detected M×N×F pattern is assigned a unique membership, such that video can be represented as collection of words from the vocabulary. We use a collection of normal traffic sequences and adopt the variational expectation minimization (EM) algorithm as proposed in [8]. During testing, frames are classified as abnormal if their likelihood is less than certain threshold value. We refer reader to [8] for more details on LDA. 3.5. Region of Abnormality In order to detect region of abnormality in scene, we utilize intelligent driver behaviors calculated in section 3.3. We adopted technique similar to [2]. Let ‘BX’ and ‘BY’ represent behaviors of particles along ‘x’ and ‘y’ direction respectively. Using finite differencing approach, we calculated spatial gradient of behaviors as, dBx/dx, dBx/dy, dBy/dx, dBy/dy. These gradients are used to compute Cauchy Green Deformation tensor. This tensor quantifies the amount by which neighboring particles have different behavior values. The maximum eigen value of this tensor is used to construct Finite Time Lyapunov Exponent (FTLE) field [10]. FTLE field, Ω, with a finite integration time, T, corresponding to a point ‘(x,y)’ at time t0 is given as ΩTt = 0 1 T ln λmax ( Δ ), 4.2 Abnormality Localization In order to localize region of abnormal behaviors, we calculated spatial gradients of behaviors as discussed in section 3.5. Note that high gradients are present at the locations where neighboring particles have quite different behavior values over length of integration ‘T’ (number of frames). FTLE field is constructed using (7). Finally, region of abnormality is segmented using watershed algorithm as shown in figure 3. Note that this kind of abnormality localization cannot be achieved without intelligent driver model. To evaluate this, instead of using spatial gradients of behaviors, we use spatial gradients of particle trajectories to construct FTLE field. FTLE field is, then, segmented using watershed algorithm with same parameter settings. Our results show that proposed (7) where λmax(∆) represents maximum eigen value of Cauchy Green Deformation tensor, ∆. The middle column of figure 3 shows the plot result of the value calculated by (7). Finally, FTLE field is segmented using watershed segmentation algorithm. 326 algorithm localize region of abnormality more accurately compare to techniques that use only optical flow or particle advection as a low level feature. Typical example is shown in figure 3. Total Frames =160 5. Conclusion (a) (i) (ii) (b) Total Frames=220 (a) (i) (ii) In this paper, we have presented an abnormality detection and localization algorithm for traffic scenes. We used interaction among cars as a main clue for abnormality detection. Our method captures the dynamics of traffic scene with high accuracy. In addition, we have shown that our method accurately localize region of abnormality, which cannot be achieved with methods based on only optical flow or particle advection. . (b) Total Frames=160 References (a) (i) (ii) [1] http://www.car.accidents.com/pages/stas.html. [2] S. Ali and M. Shah. A lagrangian particle dynamics approach for crowd flow segmentation and stability analysis. CVPR, 2007. [3] Timothy Hospedales, Shaogang Gong and Tao Xiang. A markov clustering topic model for mining behavior in video. ICCV, 2009. [4] Weiming Hu, Xuejuan Xiao, Zhouyu Fu, Dan Xie, Tieniu Tan and Steve Maybank. A system for learning statistical motion patterns. PAMI, 2006. [5] Ramin Mehran, Alexis Oyama and M. Shah. Abnormal crowd behavior detection using social force model. CVPR, 2009. [6] D. Helbing and Benno Tilch. Generalized force model of traffic dynamics. Physical review E, 58:1, 1998. [7] Wang Dahui, Wei Ziqiang, and Fan Ying. Hysteresis phenomena of the intelligent driver model for traffic flow. Physical review E, 76:016105, 2007. [8] David M. Blei, Andrew Y. Ng and Michael I. Jordan. Latent dirichlet allocation. Journal of Machine Learning Research, 3:993-1022, 2003. [9] Martin Treiber, Ansgar Hennecke and Dirk Helbing. Congested traffic states in empirical observations and microscopic simulations. Physica review E, 62:2, 2000. [10] S. C. Shadden et. al. Defination and Properties of Lagrangian Coherent Structure from Finite Time Lyapunov Exponents in Two Dimensional Aperoidic Flows. Physica D, 212, 2005. [11] Dirk Helbing. Traffic and related self-driven manyparticle system. Reviews of Modern physics, volume 11, 2001. [12] I. Saleemi, K. Shafique, and M. Shah. Probabilistic modeling of scene dynamics for applications in video surveillance. PAMI, Aug, 2009. [13] X. Wang, X. Ma, and E. Grimson. Unsupervised activity perception by hierarchical bayesian models. CVPR, 2007. (b) Total Frames=160 (a) (i) (ii) (b) Figure 2. Detection results for four different traffic sequences. (a) Normal traffic, (b) abnormal traffic. (i) Shows the detection results along the video sequence. (ii) Ground truth for each video sequence. Green area shows normal frames and red area shows the abnormal ones. (a) (b) Figure 3. Comparative results for abnormality localization with (a) Intelligent driver model and (b) without intelligent driver model. First column represent video sequence of length 200 frames. Middle column shows FTLE field computed in both cases. Third column shows final segmented region. 327


