Measuring the ordering of closely-packed particles
advertisement

Measuring the ordering of closely-packed particles
Nizan Meitav and Erez N. Ribaka)
Department of Physics, Technion – Israel Institute of Technology, Haifa 32000, Israel
We look at irregularity and phase transitions in two-dimensional patterns. Two independent methods are
provided for identifying and measuring hexagonal close packing of particles. We implemented these
methods on images of melting colloidal films at different melting processes. We could easily spot various defects in the hexagonal crystal film. The feasibility of the methods is also demonstrated on human
retinal images, for measuring the unit cell size and fraction of close-packed cone photoreceptors.
Statistical analysis indicates that phase transition in twodimensions (2D) is quite different from three dimensions.
For instance the XY model predicts algebraic dependence of
the correlation function at low temperatures preceding the
exponentially decaying one. There are various theories of the
mechanism of melting of 2D layers: formation of grains
boundaries1, formation of topological defects prior to the
transition2, etc. One of the main theories of phase transition
by lattice defects predicts a continuous phase transition into
an intermediate phase form, the hexatic phase, by dislocations of pairs in the lattice2,3. Unbinding these pairs reduces
the translational order into short range, and orientation order
into quasi-long range. Consequently, it is important to identify changes in the shapes of lattices not only for detection of
local defects but also for other forms of transitions.
The 2D arrangement of retinal photoreceptors plays a major role in determining the visual resolution (the eye size is
much larger than the receptor spacing). Better acuity can be
achieved with higher photoreceptors density, the maximum
obtained by hexagonal closed packing.4 Our brain is unable
to handle that many inputs, so only ~1mm2 of the retina has
contiguous closely packed cones, and their density decreases
rapidly towards the periphery. These are studied by high resolution imaging down to single photoreceptors, first cones5,6
and then even smaller rods.7,8 We are interested in the grid of
cones in order to understand how the eye samples an image.
We introduce two analysis methods of hexagonal patterns
of particles. The first method is based on angular analysis of
the image's Fourier transform to measure the size of the hexagons, and it functions even when the number of hexagons is
low, and their symmetry is hardly detectable. The second
method employs a matched filter to identify the hexagonal
pattern.
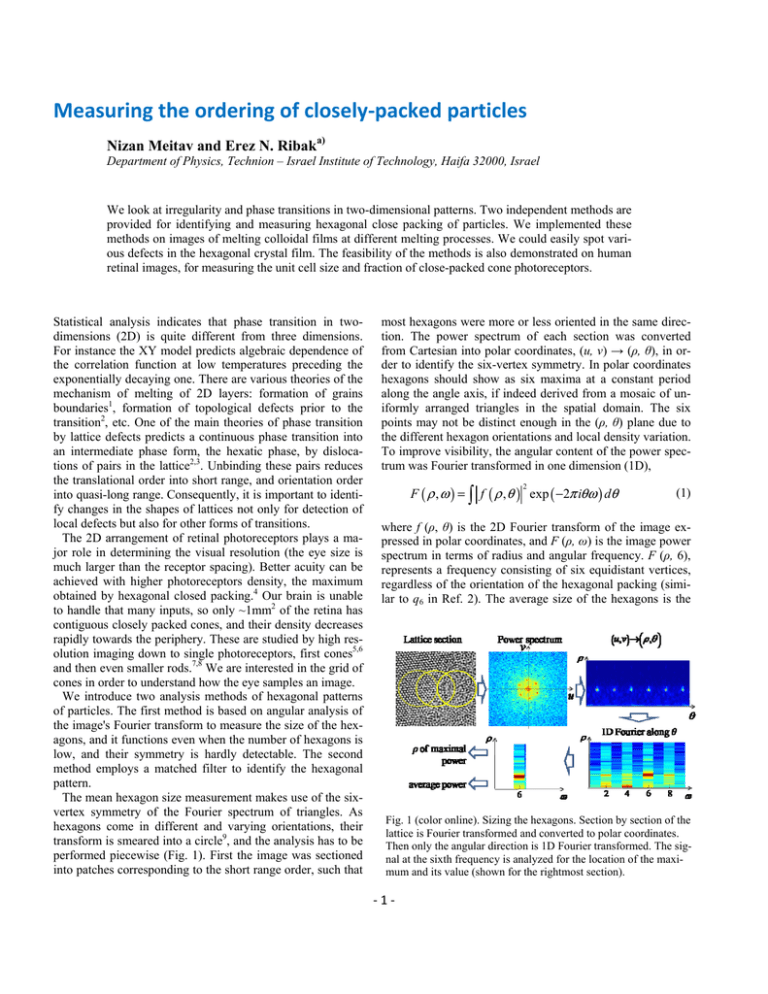
The mean hexagon size measurement makes use of the sixvertex symmetry of the Fourier spectrum of triangles. As
hexagons come in different and varying orientations, their
transform is smeared into a circle9, and the analysis has to be
performed piecewise (Fig. 1). First the image was sectioned
into patches corresponding to the short range order, such that
most hexagons were more or less oriented in the same direction. The power spectrum of each section was converted
from Cartesian into polar coordinates, (u, v) → (ρ, θ), in order to identify the six-vertex symmetry. In polar coordinates
hexagons should show as six maxima at a constant period
along the angle axis, if indeed derived from a mosaic of uniformly arranged triangles in the spatial domain. The six
points may not be distinct enough in the (ρ, θ) plane due to
the different hexagon orientations and local density variation.
To improve visibility, the angular content of the power spectrum was Fourier transformed in one dimension (1D),
2
F ( ρ , ω ) = ∫ f ( ρ , θ ) exp ( −2π iθω ) dθ
(1)
where f (ρ, θ) is the 2D Fourier transform of the image expressed in polar coordinates, and F (ρ, ω) is the image power
spectrum in terms of radius and angular frequency. F (ρ, 6),
represents a frequency consisting of six equidistant vertices,
regardless of the orientation of the hexagonal packing (similar to q6 in Ref. 2). The average size of the hexagons is the
Fig. 1 (color online). Sizing the hexagons. Section by section of the
lattice is Fourier transformed and converted to polar coordinates.
Then only the angular direction is 1D Fourier transformed. The signal at the sixth frequency is analyzed for the location of the maximum and its value (shown for the rightmost section).
-1-
value of ρ where the maximal power of F (ρ, 6) occurs; its
phase is the orientation angle, ignored here. Results were
averaged over all sections to obtain the mean F (ρ, 6). To
increase sampling, sections overlapped by half their size. The
efficacy of this method was tested on an artificial grid of
hexagons, each of size of 2.69 pixels. The hexagon side was
found to be 2.67 pixels, less than 1% disagreement.
In the second method, we identified the hexagons positions in the lattice by applying a hexagonal matched filter on
the image. The matched filter size was determined by the
mean hexagon size calculated in the above method. For retinal images we used two different sizes of masks, as photoreceptors size varies across the retina. To account for different hexagon orientations, it was sufficient to rotate each
mask also by two more steps of π/9. Each of the filtered (or
cross correlated) images was diluted by leaving only its local
maxima. Then a threshold was applied to the histogram of
the maxima to remove the filter-noise correlations. For ordered arrays, each of the hexagon correlation maxima was
surrounded by lower near-neighbor correlations9. Thus the
threshold was tuned by requiring only one correlation maximum for each hexagon in these images (ordered parts of Fig.
2). The final result was converted to a binary image.
In order to diminish the effect of different light levels at
different areas, we employed a normalized cross correlation10
γ (w) =
∑ [ f ( x ) − f ][t ( x - w ) − t ]
0.5
{∑ [ f ( x ) − f ] ∑ [t ( x - w ) − t ] }
w
x
2
x
w
2
(2)
x
where t is the template mask (i. e. a mask of hexagon vertices), f (x) is the image, f w is the mean of f (x) in the region
under the template and t is the mean of the template.
Another quantity calculated was the fraction of hexagons
out of cells or particles. For that we repeated the same analysis, but instead of taking a hexagonal mask we used a circular
one to locate single cells. The two binary images (hexagons
and cells) were first smoothed into continuous ones, then
divided to yield the local fraction of hexagons.
For retinal analysis the threshold was calibrated by requiring that density of single cells agreed with the ex-vivo data
for the same retinal region11. When the threshold value was
changed simultaneously for both steps of the analysis (hexagons and later cells) it had little influence on the ratio.
To test the reliability of this method we applied it to artificial images made of one hexagon, placed among randomly positioned particles, which occurs in both colloids and
retinal tissue. We could identify the hexagon out of 1000
such particles. For the phase transition analysis we used images of different melting processes of a colloidal film of varying thickness12. For thick, 12 layer films (Fig. 2 a,b,c) the
grain boundary melting forms a wide strip and indeed the
hexagonal lattice is reduced to floating individuals. In a thin,
4 layers film (Fig. 2 g,h,i), the hexagon map is made of local
Fig 2. (color online). Left column: Melting processes for 12, 5,
and 4 layer thickness, imaged at different magnifications and occasional blurring. Center: Corresponding hexagons’ positions,
after using the matched filter and thershold. Right: Positions
smoothed by a circular filter into hexagons’ density contours, hot
color signifying high density. Images courtesy of Y. Peng, Physics
Dept., Hong Kong University of Science and Technology.
clusters of defects all over the lattice. For an intermediate 5
layers thickness, melting was spotted both at the liquid strip
and the "lake", inside the domain, by lack of hexagon arrangement in those areas (Fig 2 d,e,f). It seems that lattice
order was also starting to break in the area between the
“lake” and the strip, maybe indicating on a start of a merging
process. The size of the smoothing filter in the right column
was varied with the size of the melting area. For the 12 layers
thickness, which has a big molten strip, we used a bigger
smoothing filter, ~10×cell size, so that the perimeter of the
solid could be identified with a specific contour. For 4 and 5
layers, where the effect is more local, we used ~7×cells size
filter.
-2-
Fig 3. (a) A defect detected in hexagonal lattice of colloidal particles (Fig. 2a). (b) Photoreceptors mosaic (~7µm spacing), courtesy of Dr. Laurent Vabre, Imagine Eyes Ltd., France.
The mean hexagon size method yielded sizes of 5.7, 7.6
and 9.0 pixels for 4, 5, and 12 layers, to be compared with
manually averaged values of 6.0, 7.8 and 9.2 pixels. The average power of F (ρ, 6) was three order of magnitude higher
than F (ρ, 5) and F (ρ, 7), indicating the dominance of hexagonal patterns. Fig. 3a is a magnified right part of Fig. 2d,
exactly where Fig. 2e indicates a defect in the lattice.
For retinal analysis we used off-center locations (nasal
parafovea) measured by others and by us4,5. Fig. 3b is a region of the retina showing the cones. First we assumed that
some of these cells are arranged in hexagonal packing, and
estimated manually the nearest neighbors spacing to be 10.8
pixels. Then we implemented our hexagon size method on
this image, and the result was 11.1 pixels.
In order to check the percentage of hexagonal packed
cells, we used a retinal image that was measured using Voronoi diagram4 (their Fig. 3d). The fraction of hexagons was
60% compared to their 57%. Fig. 4 displays locations of cells
and hexagons in a retinal image, including part of the optic
disc at the bottom right. We used our images and improved
their resolution by weighted shift-and-add sub-pixel registration5. As expected, in the optic disc the number of cones,
hexagons and their ratio (Fig. 4 b,c,d) is much lower than in
the other parts of the image. The fraction of hexagons (Fig.
4d) inside the disc is less than 10% (it should be zero), providing the level of error. Artifacts inside the large blood vessels (Fig 4b) caused this deviation. In other parts of this image the hexagon fraction was up to 30%. By implementing
the mean hexagonal size method on Fig. 4a (excluding the
optic disc), we found that the mean size is 7.69 µm. This
agrees with the minimum spacing between cones, which is
roughly constant at 6-8 µm across most of the retina.13
In summary, two independent methods were presented
for detecting and measuring the size of hexagonally packed
particles. By being sensitive even to a small deviation in the
pattern of particles, these methods enable early detection and
characterization of phase transitions. By using the same
technique for measuring single cells in the retina, the local
fraction of close-packed photoreceptors was quantified. The
distinction of these non-morphological methods is the ability
to measure the hexagonal properties where pattern discontinuity occurs, for instance melting boundaries, or the arrangement of cells near blood vessels. Notice that the
Fig 4. (color online). (a) Retinal image5 of the optic disc and its vicinity (size 1.4×1 mm2). (b) Cells positions using a round matched filter.
(c) Hexagons position using hexagonal filter. (d) The fraction of hexagons out of single cells varies from 30% to 0% (hot to cold color).
matched filter method can be used for detecting other repetitive patterns by corresponding masks, for example in small
grains, where the eye is the final judge today.
This work was supported in parts of by the Israel Science
Foundation and by the Walton Fellowship of Science Foundation Ireland.
1
S.T Chui, Phys. Rev. Lett. 48, 933 (1982).
J. M. Kosterlitz and D. J. Thouless, J. Phys. C 6, 1181
(1972).
3
U. Gasser, C. Eisenmann, G. Maret, and P. Keim, Chem.
Phys. Chem. 11, 963 (2010).
4
K. Y. Li and A. Roorda, J. Opt. Soc. Am. A. 24, 1358
(2007).
5
N. Meitav and E.N. Ribak, J. Opt. Soc. Am. A. 28, 1395
(2011).
6
J. Liang, D. R. Williams, J. Opt. Soc. Am. A. 14, 2884
(1997).
7
N. Doble, S. S. Choi, J. L. Codona, J. Christou, J. M.
Enoch, and D. R. Williams, Opt. Lett, 36, 31 (2011)
8
A. Dubra, Y. Sulai, J. L. Norris, R. F. Cooper, A. M. Dubis, D. R. Williams and J. Carroll, Biomed. Opt. Express,
2, 1864 (2011).
9
A. V. Petukhov, D. van der Beek, R. P. A. Dullens, I. P.
Dolbnya, G. J. Vroege, and H. N. W. Lekkerkerker, Phys.
Rev. Lett. 95, 077801 (2005)
10
R.C. Gonzalez and R.E. Woods, Digital image processing.
Prentice Hall (2007).
11
C. A. Curcio, K. R. Sloan, R. E. Kalina and A. E. Hendrickson, J. Comp. Neurol. 292, 497 (1990).
12
P. Y. Peng, Z. Wang, A.M. Alsayed, A.G. Yodh and Y.
Han, Phys. Rev. Lett. 104, 205703 (2010).
13
C. A. Curcio and K. R. Sloan, Vis. Neuroscience, 9, 169
(1992).
2
-3-


