THE TEAM: INSTRUCTORS: SPONSORS: REFERENCES:
advertisement
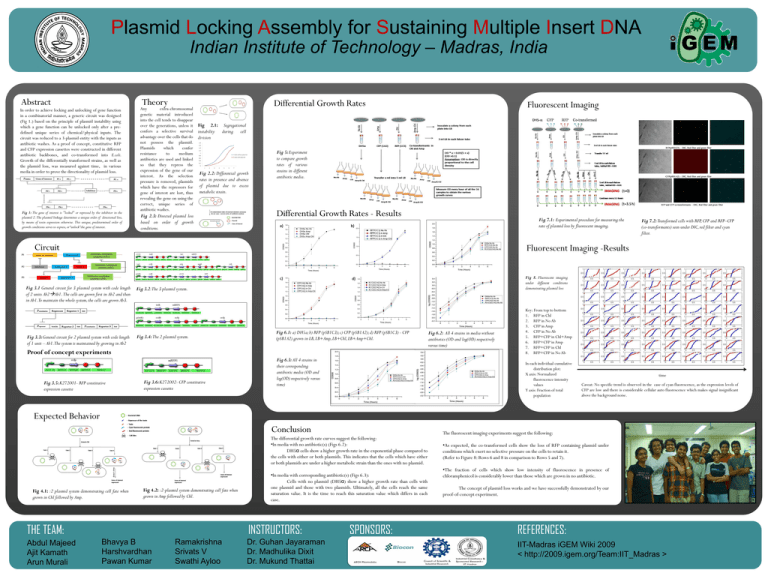
Plasmid Locking Assembly for Sustaining Multiple Insert DNA Indian Institute of Technology – Madras, India Abstract In order to achieve locking and unlocking of gene function in a combinatorial manner, a generic circuit was designed (Fig 1.) based on the principle of plasmid instability using which a gene function can be unlocked only after a predefined unique series of chemical/physical inputs. The circuit was reduced to a 3-plasmid entity with the inputs as antibiotic washes. As a proof of concept, constitutive RFP and CFP expression cassettes were constructed in different antibiotic backbones, and co-transformed into E.coli. Growth of the differentially transformed strains, as well as the plasmid loss, was measured against time, in various media in order to prove the directionality of plasmid loss. Fig 1: The gene of interest is "locked" or repressed by the inhibitor in the plasmid 2. The plasmid linkage determines a unique order of directional loss, by means of toxin expression otherwise. This unique, predetermined order of growth conditions serves to express, or “unlock” the gene of interest. Theory Any extra-chromosomal genetic material introduced into the cell tends to disappear over the generations, unless it confers a selective survival advantage over the cells that do not possess the plasmid. Plasmids which confer resistance to medium antibiotics are used and linked so that they repress the expression of the gene of our interest. As the selection pressure is removed, plasmids which have the repressors for gene of interest are lost, thus revealing the gene on using the correct, unique series of antibiotic washes. Differential Growth Rates Fluorescent Imaging Fig 2.1: Segregational instability during cell division Fig 2.2: Differential growth rates in presence and absence of plasmid due to excess metabolic strain. Fig 2.3: Directed plasmid loss based on order of growth conditions. Fig 5: Experiment to compare growth rates of various strains in different antibiotic media. Differential Growth Rates - Results Fig 7.1: Experimental procedure for measuring the rate of plasmid loss by fluorescent imaging. Circuit Fig 7.2: Transformed cells with RFP, CFP and RFP–CFP (co-transformants) seen under DIC, red filter and cyan filter. Fluorescent Imaging -Results P1 P2 Fig 8. Fluorescent imaging under different conditions demonstrating plasmid loss P3 Fig 3.1 General circuit for 3 plasmid system with code length of 2 units Ab2Ab1. The cells are grown first in Ab2 and then in Ab1.To maintain the whole system, the cells are grown Ab3. Fig 3.3: General circuit for 2 plasmid system with code length of 1 unit – Ab1.The system is maintained by growing in Ab2 Fig 3.2:The 3 plasmid system. Fig 3.4: The 2 plasmid system. Fig 6.1: a) DH5a; b) RFP (pSB1C3); c) CFP (pSB1A2); d) RFP (pSB1C3) - CFP (pSB1A2) grown in LB, LB+Amp, LB+Chl, LB+Amp+Chl. Proof of concept experiments Fig 3.5: K272001- RFP constitutive expression cassette Fig 3.6: K272002- CFP constitutive expression cassette Fig 6.3: All 4 strains in their corresponding antibiotic media (OD and log(OD) respectively versus time) Fig 6.2: All 4 strains in media without antibiotics (OD and log(OD) respectively versus time) Key: From top to bottom 1. RFP in Chl 2. RFP in No Ab 3. CFP in Amp 4. CFP in No Ab 5. RFP+CFP in Chl+Amp 6. RFP+CFP in Amp 7. RFP+CFP in Chl 8. RFP+CFP in No Ab In each individual cumulative distribution plot: X axis: Normalized fluorescence intensity values Y axis: Fraction of total population time Caveat: No specific trend is observed in the case of cyan fluorescence, as the expression levels of CFP are low and there is considerable cellular auto fluorescence which makes signal insignificant above the background noise. Expected Behavior Conclusion The differential growth rate curves suggest the following: •In media with no antibiotic(s) (Figs 6.2): DH5α cells show a higher growth rate in the exponential phase compared to the cells with either or both plasmids. This indicates that the cells which have either or both plasmids are under a higher metabolic strain than the ones with no plasmid. Fig 4.1: :2 plasmid system demonstrating cell fate when grown in Chl followed by Amp. Fig 4.2: :2-plasmid system demonstrating cell fate when grown in Amp followed by Chl. THE TEAM: Abdul Majeed Ajit Kamath Arun Murali •In media with corresponding antibiotic(s) (Figs 6.3): Cells with no plasmid (DH5α) show a higher growth rate than cells with one plasmid and those with two plasmids. Ultimately, all the cells reach the same saturation value. It is the time to reach this saturation value which differs in each case. INSTRUCTORS: Bhavya B Harshvardhan Pawan Kumar Ramakrishna Srivats V Swathi Ayloo Dr. Guhan Jayaraman Dr. Madhulika Dixit Dr. Mukund Thattai SPONSORS: The fluorescent imaging experiments suggest the following: •As expected, the co-transformed cells show the loss of RFP containing plasmid under conditions which exert no selective pressure on the cells to retain it. (Refer to Figure 8: Rows 6 and 8 in comparison to Rows 5 and 7). •The fraction of cells which show low intensity of fluorescence in presence of chloramphenicol is considerably lower than those which are grown in no antibiotic. The concept of plasmid loss works and we have successfully demonstrated by our proof-of-concept experiment. REFERENCES: IIT-Madras iGEM Wiki 2009 < http://2009.igem.org/Team:IIT_Madras >

