From The Physics Classroom’s Physics Interactive
http://www.physicsclassroom.com
Optics Bench – Mathematical Relationships
Purpose: To investigate the mathematical relationship between object distance, image distance,
and focal length.
Getting Ready: Navigate to the Optics Bench simulation found in the Physics Interactives
section of The Physics Classroom.
http://www.physicsclassroom.com/Physics-Interactives/Reflection-and-Mirrors/Optics-Bench
Navigation:
www.physicsclassroom.com => Physics Interactives => Reflection and Mirrors => Optics Bench
Getting Acquainted:
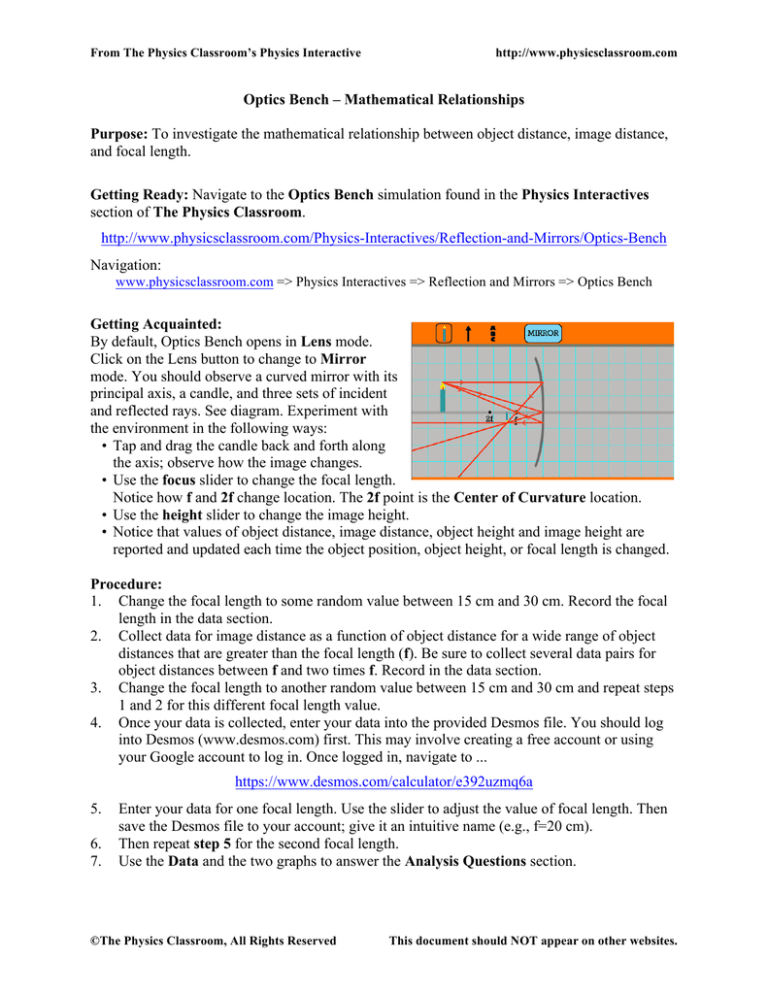
By default, Optics Bench opens in Lens mode.
Click on the Lens button to change to Mirror
mode. You should observe a curved mirror with its
principal axis, a candle, and three sets of incident
and reflected rays. See diagram. Experiment with
the environment in the following ways:
• Tap and drag the candle back and forth along
the axis; observe how the image changes.
• Use the focus slider to change the focal length.
Notice how f and 2f change location. The 2f point is the Center of Curvature location.
• Use the height slider to change the image height.
• Notice that values of object distance, image distance, object height and image height are
reported and updated each time the object position, object height, or focal length is changed.
Procedure:
1. Change the focal length to some random value between 15 cm and 30 cm. Record the focal
length in the data section.
2. Collect data for image distance as a function of object distance for a wide range of object
distances that are greater than the focal length (f). Be sure to collect several data pairs for
object distances between f and two times f. Record in the data section.
3. Change the focal length to another random value between 15 cm and 30 cm and repeat steps
1 and 2 for this different focal length value.
4. Once your data is collected, enter your data into the provided Desmos file. You should log
into Desmos (www.desmos.com) first. This may involve creating a free account or using
your Google account to log in. Once logged in, navigate to ...
https://www.desmos.com/calculator/e392uzmq6a
5.
6.
7.
Enter your data for one focal length. Use the slider to adjust the value of focal length. Then
save the Desmos file to your account; give it an intuitive name (e.g., f=20 cm).
Then repeat step 5 for the second focal length.
Use the Data and the two graphs to answer the Analysis Questions section.
©The Physics Classroom, All Rights Reserved
This document should NOT appear on other websites.
From The Physics Classroom’s Physics Interactive
http://www.physicsclassroom.com
Data:
Table 1
Table 2
f = ___________ cm
f = ___________ cm
dobject (cm)
dimage (cm)
dobject (cm)
dimage (cm)
Analysis Questions:
1. Here's a basic observation: As the object distance increases, the image distance
_____________________ (increases, decreases, remains unchanged).
2.
There is a lower limit on the value of image distance. Image distance values cannot go any
lower than this limit. Compare the lower limit for your two graphs. What determines this
lower limit? Make a claim and then support the claim by referencing your evidence and
using good logical reasoning.
©The Physics Classroom, All Rights Reserved
This document should NOT appear on other websites.
From The Physics Classroom’s Physics Interactive
3.
http://www.physicsclassroom.com
There is a gold line on your Desmos graph and a slider (labeled M) that controls the slope of
this line. We will call it the magnification line. Now imagine a best-fit curve that fits your
data and imagine the intersection between this best-fit curve and the magnification line.
Determine the coordinates of the intersection point for the following M values. You may
wish to collect more data from The Physics Classroom Interactive to complete this task.
Once complete, all but the first three columns of the 6-column table will be complete.
focal length = _____________ cm
M
dobject (cm)
dimage (cm)
hobject (cm)
himage (cm)
himage/hobject
1.00
2.00
3.00
0.50
focal length = _____________ cm
M
dobject (cm)
dimage (cm)
hobject (cm)
himage (cm)
himage/hobject
1.00
2.00
3.00
0.50
4.
Return to The Physics Classroom Interactive and set the focal length and the object distance
to the values listed in the above tables. Use an object height of around 20 cm; record.
Measure the image heights for each row and calculate the himage/hobject ratio. The two tables
above should be complete after this step.
5.
Analyze your data in the two tables above. For each table, identify the object distance that is
required in order for the image to be the same size as the object (himage/hobject = 1.00). Can
you state how many times greater this object distance is than the focal length? Make a claim
and support it with by discussing the evidence. Use good logical reasoning.
©The Physics Classroom, All Rights Reserved
This document should NOT appear on other websites.
From The Physics Classroom’s Physics Interactive
http://www.physicsclassroom.com
6.
As a follow-up to the previous question: If one has a concave mirror with a focal length of
50.0 cm, then for what object distance would the image height be the same height of the
object? _____________ Explain your answer.
7.
Analyze your data from Question #3. Which one of the following statements is true?
himage
hobject
>>
dimage
dobject
himage
hobject
=
dimage
dobject
himage
hobject
<<
dimage
dobject
Circle your answer and use one example from one of the data tables to help explain the logic
behind your choice.
©The Physics Classroom, All Rights Reserved
This document should NOT appear on other websites.


