Understanding and Dealing with Ferroresonance
advertisement
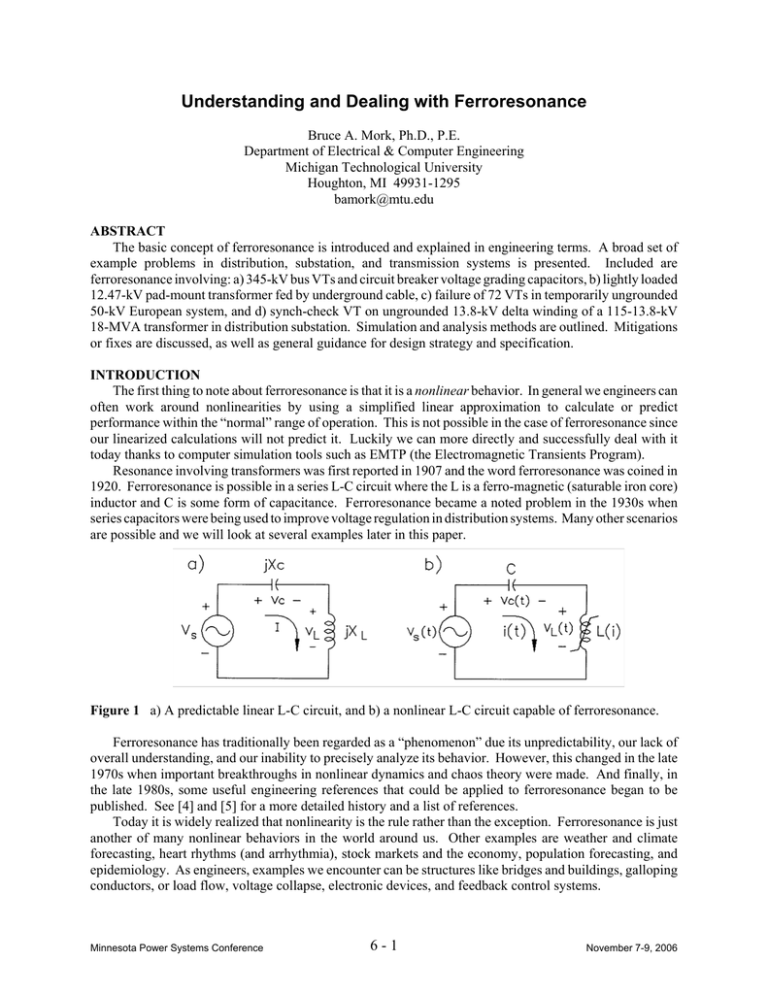
Understanding and Dealing with Ferroresonance Bruce A. Mork, Ph.D., P.E. Department of Electrical & Computer Engineering Michigan Technological University Houghton, MI 49931-1295 bamork@mtu.edu ABSTRACT The basic concept of ferroresonance is introduced and explained in engineering terms. A broad set of example problems in distribution, substation, and transmission systems is presented. Included are ferroresonance involving: a) 345-kV bus VTs and circuit breaker voltage grading capacitors, b) lightly loaded 12.47-kV pad-mount transformer fed by underground cable, c) failure of 72 VTs in temporarily ungrounded 50-kV European system, and d) synch-check VT on ungrounded 13.8-kV delta winding of a 115-13.8-kV 18-MVA transformer in distribution substation. Simulation and analysis methods are outlined. Mitigations or fixes are discussed, as well as general guidance for design strategy and specification. INTRODUCTION The first thing to note about ferroresonance is that it is a nonlinear behavior. In general we engineers can often work around nonlinearities by using a simplified linear approximation to calculate or predict performance within the “normal” range of operation. This is not possible in the case of ferroresonance since our linearized calculations will not predict it. Luckily we can more directly and successfully deal with it today thanks to computer simulation tools such as EMTP (the Electromagnetic Transients Program). Resonance involving transformers was first reported in 1907 and the word ferroresonance was coined in 1920. Ferroresonance is possible in a series L-C circuit where the L is a ferro-magnetic (saturable iron core) inductor and C is some form of capacitance. Ferroresonance became a noted problem in the 1930s when series capacitors were being used to improve voltage regulation in distribution systems. Many other scenarios are possible and we will look at several examples later in this paper. Figure 1 a) A predictable linear L-C circuit, and b) a nonlinear L-C circuit capable of ferroresonance. Ferroresonance has traditionally been regarded as a “phenomenon” due its unpredictability, our lack of overall understanding, and our inability to precisely analyze its behavior. However, this changed in the late 1970s when important breakthroughs in nonlinear dynamics and chaos theory were made. And finally, in the late 1980s, some useful engineering references that could be applied to ferroresonance began to be published. See [4] and [5] for a more detailed history and a list of references. Today it is widely realized that nonlinearity is the rule rather than the exception. Ferroresonance is just another of many nonlinear behaviors in the world around us. Other examples are weather and climate forecasting, heart rhythms (and arrhythmia), stock markets and the economy, population forecasting, and epidemiology. As engineers, examples we encounter can be structures like bridges and buildings, galloping conductors, or load flow, voltage collapse, electronic devices, and feedback control systems. Minnesota Power Systems Conference 6-1 November 7-9, 2006 FERRORESONANCE BASICS It’s useful to contrast the behavior of an unloaded transformer energized at rated voltage (Figure 2), with that of the same transformer with a capacitor placed in series with the source (Figure 3). This example is an actual laboratory measurement of a small 1.5-kVA 120-240-V dry transformer. This is the same problem caused by the series capacitors used in distribution systems 70 years ago. It is quite clear that the transformer terminal voltage at X1-X0 and H1-H0 is much too high and extremely laden with odd harmonics, hardly what a utility customer expects and demands. Figure 2 Unloaded transformer, rated 120-V excitation. Peak current is less than 1.0 A. Figure 3 Ferroresonance, main interaction is between CS and LM. Same transformer as in Figure 2, energized through a 75 μF capacitor. Peak current is now 34 A, peak voltage is 240 V (1.44 p.u.). Minnesota Power Systems Conference 6-2 November 7-9, 2006 Whether ferroresonance occurs or not depends on the value of capacitance CS and the saturation curve of the transformer core represented by LM. The nonlinearity involved makes it impossible to predict whether ferroresonance will occur or not, and if so how severe the overvoltage will be. More than one mode of ferroresonance is possible, and operation may jump in and out of ferroresonance depending on switching angle. In general, the basic criteria which make ferroresonance possible are as follows: • • • A capacitance in series with the core’s magnetizing inductance (look for the series L-C ! ), Unloaded or lightly loaded transformer (very rough rule of thumb: below 10-20% rated load), Single-pole switching procedures or interrupting devices in a three-phase system. Transformers of any type and size may be involved. The most common cases are single-phase power transformers and voltage transformers energized through a series capacitance, and three-phase distribution transformers subject to single-pole switching or interruption. Shunt reactors with a saturable core could also be possible. Power transformers switched with three-phase gang-operated circuit breakers are unlikely candidates. Capacitance can be in the form of actual capacitor banks, or as capacitive coupling. Actual “cap banks” are easy to visualize, but capacitive coupling effects can be more difficult to identify. • • • • Series capacitor for line compensation. Shunt capacitor banks. Underground cable. Capacitive coupling, double circuit line • • • • Systems grounded only via stray capacitance. Grading capacitors on circuit breakers. Generator surge capacitors. Capacitive coupling internal to transformer. PRACTICAL EXAMPLES Case 1 - Shunt capacitor banks A three-phase bank of unloaded or lightly loaded single-phase transformers can experience ferroresonance when one or two of the three source phases are disconnected due to switching or fuse clearing (Figure 4) [7, 8]. Make special note of the series L-C connection through zero sequence neutral path. Figure 4 Possible ferroresonance with shunt cap banks. Neutral path provides series L-C connection. Minnesota Power Systems Conference 6-3 November 7-9, 2006 Case 2 - VT Ferroresonance in Temporarily Ungrounded System This is an actual case near Moss, Norway [3]. System grounding on an extensive part of their 50-kV system was lost after clearing a fault. After only 3 minutes, there was a failure of 72 VTs, all of the same manufacturer. VTs made by two other manufacturers remained in service and incurred no damage. This was quite troubling and a detailed investigation was carried out. Figure 5 Left: Three-phase set of VTs with additional secondaries in broken-delta to allow damping resistor. Right: EMTP model using an aggregate representation of all VTs in system. Lineground coupling capacitance is lumped as effective zero-sequence C0. The existing design standard called for a damping resistor R0 of 60 Ohms, but this obviously had not provided enough damping to prevent the failure of 72 VTs. Saturation curves were obtained for the VTs of the three manufacturers and an EMTP model was constructed. The model was actually quite simple in this case. All capacitance was lumped into the zero sequence path at the neutral. Line impedances could be neglected since they were very small compared to the core impedance of the aggregated VTs. Simulations showed that ferroresonance would not occur if damping was increased by specifying an R0 of 10 Ohms. Further investigation revealed that the saturation curve of the failed VTs (VT#1) was considerably lower than the others making it easier for them to be driven into saturation. All VTs met steady-state metering and relay accuracy requirements. Figure 6 Comparison of the three λ-i saturation curves. Minnesota Power Systems Conference 6-4 November 7-9, 2006 It’s clear that manufacturers can use very different designs to meet the same accuracy requirements. Having since worked with a few other VTs, it seems typical to design a VT to have the knee of its saturation curve somewhere between 1.65 and 2.0 p.u. Manufacturer #1obviously did not follow that approach, designing to put the knee around 1.5 p.u. which allows saturation at a lower voltage level than otherwise would occur. Recall that ferroresonance cannot occur unless the core saturates (becomes nonlinear) so the design of VT#1 might be considered to be “riskier” than the other two. Why did they design it this way? A quick check of the magnetic circuit design parameters shows that the cross-sectional area of a core with a lower knee point is less than with a higher knee, making for a lighter and more cost-competitive product. Case 3 - Synch-check VT on Ungrounded 13.8-kV Transformer Tertiary This is a situation that the author encountered on a project in Greenwood, MS. A new 115-kV line was brought in to a municipal power plant and stepped down by a 115-13.8-kV Y-Δ transformer. Synch check had to be performed whenever closing the 13.8-kV switchgear breaker. A single VT for that purpose was thus installed on the transformer side of the breaker. The VT had a primary-side fuse. A a VT c B b b VT C c i resonant a 52b 200 W Figure 7 Left: Y-Δ transformer. Note internal capacitive coupling and series L-C path. Right: correction of problem by automatically connecting a damping resistor when breaker opens. Energizing the new transformer for the first time from the 115-kV side, the VT’s primary fuse blew. The VT’s turns ratio and winding resistances checked out OK. Trying again with a new fuse, it blew again. Some head scratching ensued. Not having an oscilloscope or event recorder of any type, the exact problem could not be identified. However, I speculated that it could possibly be ferroresonance. We attached a 200W burden on the VT (a couple of 100W light bulbs) and energized it again. The fuse held, everything was normal, and we continued with energization testing. Figure 7 illustrates the capacitive coupling that exists between windings, and between windings and ground. The bushings also contribute to the capacitance to ground. As shown on the left side of Figure 7, there is thus a series L-C path involving the magnetizing inductance of the core of the VT. Although a simulation or analysis could not be done in this case, loading the VT solved the problem. The design was changed so that a 200-W ceramic resistor was switched on via a 52b contact whenever the breaker was open. Case 4 - Bus VT Failures on 345-kV Bus This is a case presented earlier this year [9] and shared by the authors. The event waveforms were captured in detail. Bus 2 was to be deenergized in order to replace a lightning arrester. Breakers were opened on the 115-kV side of the transformer, then breakers 8P25 and 8P28 were opened, then breaker 8P22 was Minnesota Power Systems Conference 6-5 November 7-9, 2006 opened, followed by the operation of the four MODs. The switching sequence is given in Figure 9. As the MODs opened one by one, high rms voltages of about 130% appeared on the VTs of phases A and B, oil was vented, and then the two VTs failed. This is a very interesting case in that there are 3 separate series feeds through the voltage grading capacitors on each of the 345-kV breakers, and while the transformer TR10 is attached it also has an effect on the operating impedance of the circuit which includes the VTs. Thus, there are 15 different energized configurations through the grading capacitors, depending on the MODs’ positions. 345kV Bus 2 8P22 8P21 8P20 8P25 8P24 8P23 8P28 8P27 PT Red Rock Subtation TR 10 K5 943 115kV Figure 8 Two of three of the Bus 2 VTs failed during switching sequence to deenergize Bus 2. From [9]. The sequence of events and some of the ferroresonant voltage waveforms recorded are given as follows. Note that in this case failure occurs after roughly 20 minutes. • • • • • 07:15:14 07:15:40 07:16:18 07:34:16 07:42:08 8P22 opened TR 10 MOD opened 8P22 A MOD opened Va drops to 50% (failure after 18 minutes) Vb drops to 41% (failure after 26 minutes) Figure 9 Event record of VT secondary voltages during and after opening of 8P22. Minnesota Power Systems Conference 6-6 November 7-9, 2006 Case 5 - Ferroresonance in Cable-Fed 12.47-kV Padmount Distribution Transformers This case involved failures of padmount distribution transformers used primarily to serve irrigation loads. Obviously, these transformers were unloaded much of the time. In some cases, a cable fault would be cleared by a fuse at the riser pole, but backfeed voltage would continue to appear on the load side of the fuse. When the fault was located and repaired, “burn-back” of the cable insulation from the fault back toward the transformer was observed. Field measurements were taken, detailed laboratory tests were performed on a transformer, an EMTP computer model was developed, and great progress was made on understanding this [1, 2, 5, 6]. The basic system configuration is grounded-Y with GY-GY transformer, as shown in Figure 10. Figure 10 Typical cable-fed gounded-Y system. Cable capacitance increases with length. Figure 11 Transformer core design determines if (or how much) backfeed voltage is present. Minnesota Power Systems Conference 6-7 November 7-9, 2006 The backfeed voltage was also present during single-pole switching procedures and obviously this was a safety issue as well as an equipment damage issue. Figure 11 shows the most common types of transformer core designs for three-phase transformers. The Five-Legged “Separated” or Wound Core is typically used in these pad-mounts. A 75-kVA 12.47-kV - 480-V padmount was brought into the lab. It is apparent that except for the triplexed design, there will always be a backfeed voltage on the open phase. An “unenergized” phase of the GY-GY five-legged wound core will have an induced “backfeed” voltage of about 50% due to magnetic coupling to the adjacent phase, if the adjacent phase is energized. Further, if the detailed equivalent circuit of the transformer is examined, it can be shown that this backfeed voltage feeds a series L-C combination of the cable capacitance and the nonlinear magnetizing inductance of the core. Thus, ferroresonance could be possible on the open phase(s). Many different types of waveforms can be observed depending on cable length (and resulting capacitance), and which phase(s) are open. Several examples are shown here for Phase A open and Phases B and C energized. There is no logical or predictable pattern to the behaviors, so be careful not to rely on trending, linearizing, or extrapolating. For the same set of parameters, multiple possible steady-state behaviors are possible. Figure 12 Top: C = 9 μF. Period 1 (60 Hz) response. Bottom: C = 10 μF. Period 2 (30 Hz) response. Minnesota Power Systems Conference 6-8 November 7-9, 2006 Figure 13 Top: C = 17 μF. Period 5 (12 Hz) response. Center: C = 18 μF. Chaotic (nonperiodic) response. Bottom: C = 25 μF. Period 3 (20 Hz) response. Thus, it is not possible to predict in any simple way whether ferroresonance will occur, the waveshape and seriousness of the overvoltage, or the potential damage it might cause. But with EMTP, a bifurcation simulation can be run to determine what might happen within the expected range of capacitance [4, 5, 6]. Minnesota Power Systems Conference 6-9 November 7-9, 2006 CONCLUSIONS There are three main situations where ferroresonance needs to be understood: system operation, system design, and failure analysis. The main risks are personnel safety, equipment damage, customer outages, and damage to customer equipment. Most utilities have been gradually refining single-pole switching and operational guidelines to avoid problems. Design engineers are becoming more aware of scenarios to avoid and taking general precautions in design. EMTP simulation requires very detailed information and parameters on the transformer involved, and has been used mostly for failure analysis so far. It is hoped that detailed EMTP tools can become more widely available at the design engineering stage. REFERENCES 1) D.L. Stuehm, B.A. Mork, and D.D. Mairs, "Ferroresonance with Three-Phase Five-Legged Core Transformers", Proceedings of Minnesota Power Systems Conference, Minneapolis, MN, October 3, 1988. 2) D.D. Mairs, D.L. Stuehm, and B.A. Mork, "Overvoltages on Five Legged Core Transformers on Rural Electric Systems", IEEE Trans. Industrial Applications, vol. 25, no. 2, pp. 366-370, March, 1989. 3) T. Henriksen and O. Rørvik, “Ferroresonans i 50-kV Nett til Hafslund” (in Norwegian), Energiforsyningens Forskningsinstitutt A/S, Trondheim, Norway, ISBN 82-594-0229-7, EFI TR 3779, Dec. 19, 1990. 4) B.A. Mork, Ferroresonance and Chaos - Observation and Simulation of Ferroresonance in a Five-Legged Core Distribution Transformer, Ph.D. Dissertation, North Dakota State University, copyright © May 1992. 5) B.A. Mork and D.L. Stuehm, "Application of Nonlinear Dynamics and Chaos to Ferroresonance in Distribution Systems", IEEE Trans. Power Delivery, vol. 9, no. 2, pp. 1009-1017, April 1994. 6) B.A. Mork, "Five-Legged Wound-Core Transformer Model: Derivation, Parameters, Implementation, and Evaluation", IEEE Trans. Power Delivery, vol. 14, no. 4, pp. 1519-1526, October 1999. 7) B.A. Mork, et.al., “Modeling Guidelines for Low Frequency Transients,” Chapter 3 , IEEE Special Publication TP-133-0, Modeling and Analysis of System Transients Using Digital Programs, pp. 3-1 to 3-29, IEEE Catalog No. 99TP133-0. 8) M.R. Iravani, A.K.S. Chaudhary, W.J. Giewbrecht, I.E. Hassan, A.J.F. Keri, K.C. Lee, J.A. Martinez, A.S. Morched, B.A. Mork, M. Parniani, A. Sarshar, D. Shirmohammadi, R.A. Walling, D.A. Woodford, "Modeling and Analysis Guidelines for Slow Transients: Part III: The Study of Ferroresonance," IEEE Trans. Power Delivery, vol. 15, no. 1, pp. 255-265, January 2000. 9) T. Sarkinen, R. Judkins, "The Revealing Switching Procedure," presented in Real World Experiences session, Texas A&M Relay Conference, March 27-29, 2006. Author Biography Bruce Mork was born in Bismarck, ND and grew up on a family farm in the Missouri River valley 8 miles north of Mandan, ND. He earned the BSME, MSEE, and Ph.D. in Electrical Engineering from North Dakota State University in 1979, 1981 and 1992 respectively. From 1982 through 1986 he was design engineer at Burns and McDonnell Engineering in Kansas City, MO, in the areas of substation design, protective relaying, and communications. He worked 3 years in Norway on power systems issues: 1989-90 as research engineer for the Norwegian State Power Board in Oslo; 1990-91 as visiting researcher at the Norwegian Institute of Technology in Trondheim; and 2001-02 as Fulbright Fellow and Visiting Senior Scientist at SINTEF Energy Research, Trondheim. He joined the faculty of Michigan Technological University in 1992, where he is now Associate Professor of Electrical Engineering, and Director of the Power & Energy Research Center. Dr. Mork is a member of IEEE, ASEE, and NSPE. He is a registered Professional Engineer in the states of Missouri and North Dakota. He is Chairman of the IEEE Working Group on "Practical Aspects of Ferroresonance," and this Working Group is in the process of writing a practical engineer's tutorial and guideline. Minnesota Power Systems Conference 6 - 10 November 7-9, 2006
