WHITE
PAPER
Single Particle Inductively Coupled Plasma
Mass Spectrometry: Understanding How and Why
Authors
Chady Stephan
Ken Neubauer
PerkinElmer, Inc.
Shelton, CT
Introduction
Nanotechnology is an emerging and rapidly growing field
whose dynamics and prospects pose many great challenges
to scientists and engineers. Nanoparticles are being used in
many materials and products, including coatings (on plastic,
glass and clothing), sunscreen, antimicrobial bandages and
clothing, MRI contrast agents, biomedical elemental tags and
fuel additives, only to name few. However, rapid, simultaneous
characterization of their elemental composition, number of
particles, size, and size distribution is challenging. For inorganic
nanoparticles, the technique best suited to provide the abovementioned characteristics is inductively coupled plasma mass
spectrometry (ICP-MS) operated in so-called single particle
mode. Analyzing single nanoparticles with ICP-MS requires
a different approach than measuring dissolved elements.
This work describes the theory behind single-particle ICP-MS
measurements, drawing comparisons and differences with
analyzing dissolved elements.
for the electronics to stabilize before the next measurement
is performed. This stabilization time is called “settling time”,
i.e. overhead and processing time. When analyzing dissolved
elements, the resulting signal is essentially a steady-state signal,
as shown in Figure 2a. However, considering the dwell and
settling times, a significant amount of the signal is not measured
due to the settling time of the electronics, a critical aspect when
analyzing nanoparticles (Figure 2b).
a
Understanding Single Particle ICP-MS Analysis
Effectively detecting and measuring single, individual
nanoparticles with ICP-MS requires operating the
instrumentation in a different manner than when analyzing
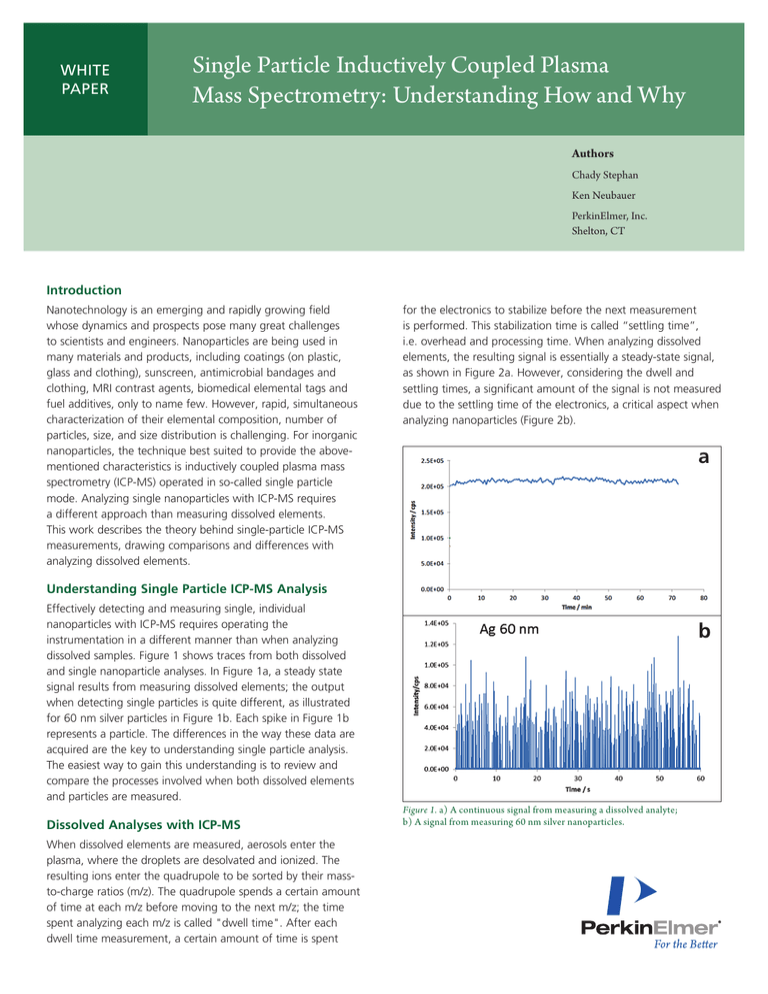
dissolved samples. Figure 1 shows traces from both dissolved
and single nanoparticle analyses. In Figure 1a, a steady state
signal results from measuring dissolved elements; the output
when detecting single particles is quite different, as illustrated
for 60 nm silver particles in Figure 1b. Each spike in Figure 1b
represents a particle. The differences in the way these data are
acquired are the key to understanding single particle analysis.
The easiest way to gain this understanding is to review and
compare the processes involved when both dissolved elements
and particles are measured.
Dissolved Analyses with ICP-MS
When dissolved elements are measured, aerosols enter the
plasma, where the droplets are desolvated and ionized. The
resulting ions enter the quadrupole to be sorted by their massto-charge ratios (m/z). The quadrupole spends a certain amount
of time at each m/z before moving to the next m/z; the time
spent analyzing each m/z is called "dwell time". After each
dwell time measurement, a certain amount of time is spent
b
Figure 1. a) A continuous signal from measuring a dissolved analyte;
b) A signal from measuring 60 nm silver nanoparticles.
For dissolved ions, the part of the signal which is missed is
not critical since the elements are dissolved and produce a
continuous signal.
Single Particle Analyses with ICP-MS
Particles present in an aqueous solution are introduced to the
plasma the same way as dissolved solutions. As the droplets
are desolvated in the plasma, the resulting particles are ionized
producing a burst of ions (one ion cloud per particle). The ions
then pass into the quadrupole. However, using conventional
ICP-MS data collection, alternating between dwell time and
settling time, ion clouds are not always detected. If, for
example, the ion cloud happens to fall within the dwell time
window, it will be detected. Otherwise, if it passes into the
quadrupole or reaches the detector during the settling time,
it will not be detected, leading to an inaccurate counting
efficiency. Figure 3a shows that an ion cloud from a single
particle (the “Signal” peak) can be missed if it falls outside
of the dwell time window. When the ion cloud from a single
particle falls within the dwell time window, it is detected, as
represented in Figure 3b. When multiple particles are detected
in rapid succession, the resulting signal is a series of peaks, each
one originating from a particle, as shown in Figure 3c.
a
b
Figure 2. a) A continuous signal from measuring a dissolved element;
b) A continuous signal, with the dwell and settling times overlaid – data is
only collected during the dwell time.
2
The Timing Parameters of Single Particle ICP-MS
Figure 4 is a representation of the timing parameters involved in
ICP-MS analysis. The three axes represent signal intensity, mass
(m/z), and time. With conventional/dissolved analyses, the mass
and intensity axes are the most important: resulting spectra
are plots of m/z vs. intensity. The time axis is important when
considering how fast the quadrupole can move from mass-tomass – this parameter is called "quadrupole scan speed". The
quadrupole scan speed is important when measuring multiple
elements in a transient signal, such as for laser ablation and
multielement speciation analyses.
a
b
c
Figure 3. a) Signal from a single nanoparticle falling outside of the dwell
time/measurement window, and, therefore, not detected; b) Signal from a
single nanoparticle falling within the dwell time/measurement window, and,
therefore, detected; c) Signals from multiple nanoparticles falling within
dwell time/measurement windows and detected.
a
b
c
Figure 4. The timing parameters of ICP-MS analyses.
When measuring transient signals for a single m/z, the time axis
becomes important, since enough data points must be acquired
to define the peak. For example, with HPLC/ICP-MS, usually
4-10 points/second are enough to define a peak. Comparing
HPLC peaks to single particle signals, the ion packets from each
particle are typically 1000 times narrower than peaks produced
by HPLC. Therefore, data must be acquired significantly faster
for single particle analysis. Since only a single mass is being
measured for single particle analysis, the quadrupole scan speed
is not important, and the time axis becomes the "transient data
acquisition speed", which encompasses both the dwell and
settling times. The faster the transient data acquisition speed, the
better suited the system is for single particle analysis.
In single particle ICP-MS, transient data acquisition speed
consists of two parameters: dwell time (reading time) and settling
time (overhead and processing time). It is very important that the
ICP-MS is able to acquire signals at a dwell time that is shorter
than the particle transient time, thus avoiding false signals
generated from partial particle integration, particle coincidence
and agglomerates/aggregates. The shorter the settling time, the
less chance there is of missing a particle. Figure 5 demonstrates
the importance of settling time using a constant 100 μs dwell
time and a constant time window. In Figure 5a, there are only
two 100 μs windows to detect particles; the rest of the time is
overhead, where data cannot be acquired. In this case, there are
only about 100 measurements made in one second. Therefore,
most of the time is wasted. Figure 5b is the same time scale,
but with a settling time of 100 μs. Therefore, more time is
spent measuring and looking for nanoparticles – about 5000
measurements in one second. However, still half of the time is
wasted. Figure 5c represents the ideal situation with no settling
time. This allows for 10,000 measurements per second, with no
wasted time: all the time is spent looking for particles, the ideal
situation for single particle ICP-MS.
Figure 5. Effect of settling time and dwell time on ICP-MS measurements:
a) Settling time is much longer than the dwell time; b) Settling time is equal
to the dwell time; c) Settling time is eliminated.
Figure 6. Effect of dwell and settling times on single nanoparticle measurements:
a) Two particles detected; b) One particle detected; c) The leading edge
of one particle detected; d) The trailing edge of one particle detected;
e) No particles detected.
Multiple Measurements per Particle:
The Ideal Situation
To understand the importance of fast sampling time for single
particle measurements, consider the representation in Figure 6.
In this figure, the upper portion represents pulses from single
particles as they relate to dwell and settling times, while the
lower portion shows the corresponding mass spectrometer
response (intensity vs. time). In Figure 6a, two particles are
detected in a single dwell time window, leading to a response
twice as large as if one particle were detected, not a desirable
situation and easily encountered if the instrument dwell time
is longer than the nanoparticle transient pulse. In Figure 6b,
3
a single particle is detected in the dwell time window – the ideal
situation, if fast continuous data acquisition was not available.
The resulting signal is half the size of Figure 6a. Figures 6c and
6d represent undesirable situations where only a part of the
ion pulse from particles is detected, leading to small signals,
thus inaccurate particle sizing. Figure 6e represents the most
undesirable situation, where the particle falls outside of the dwell
time window and is not detected. These examples demonstrate
the importance of having fast continuous data acquisition ability,
where data is collected continuously without any settling time,
ensuring accurate particle counting - every particle entering the
plasma will be counted.
Figures 8a and 8b show how typical single particle responses can
be converted into peaks which define a single particle. In Figure
8a, data was collected in fast continuous mode (no settling time)
b
ICP-MS Counts
a
Another benefit of fast continuous data acquisition is that
multiple points can be measured from a single particle, thus
eliminating the chances that particles are missed or that only
partial ion clouds from particles are detected. Figure 7 shows
how this can be accomplished. In Figure 7a, the signal from a
single particle is measured multiple times. The signal from each
time slice is plotted, which defines the peak. When multiple
particles are detected, the resulting peaks are a series of time
slices, as shown in Figure 7b.
Figure 7. Effect of measuring multiple measurements per particle: a) For a single particle and b) For multiple particles detected in series.
4
a
Dwell Time: 100 µs
b
Dwell Time: 50 µs
Figure 8. Ability to acquire multiple measurements per particle: a) 6 data points per particle; b) 12 data points per particle.
with a dwell time of 100 µs. When the intensities from the first
1.6 seconds are plotted, it is seen that 6 points define a peak. In
Figure 8b, the dwell time was reduced to 50 µs, which leads to
twice as many data points being acquired. As a result, the peak
shape is defined by 12 points, leading to a different peak shape.
These examples demonstrate the benefit of sampling multiple
data points per particle.
Summary
As has been shown, measuring single particles with ICP-MS
is quite different than measuring dissolved species. The most
important factor when measuring single particles is the speed
at which data can be acquired: since particle ionization events
are on the order of microseconds, rapid data acquisition and
elimination of the settling time between measurements are
crucial. Continuous measurement allows multiple readings per
particle ionization event, which results in more accurate size
determinations. For single particle ICP-MS analysis, continuous
data acquisition at a dwell time smaller than or equal to 100
µs is the most important instrumental requirement for precise
nanoparticle counting and sizing.
PerkinElmer, Inc.
940 Winter Street
Waltham, MA 02451 USA
P: (800) 762-4000 or
(+1) 203-925-4602
www.perkinelmer.com
For a complete listing of our global offices, visit www.perkinelmer.com/ContactUs
Copyright ©2014, PerkinElmer, Inc. All rights reserved. PerkinElmer® is a registered trademark of PerkinElmer, Inc. All other trademarks are the property of their respective owners.
011649_01


