the Twin Cities Metropolitan Area in 2013
advertisement
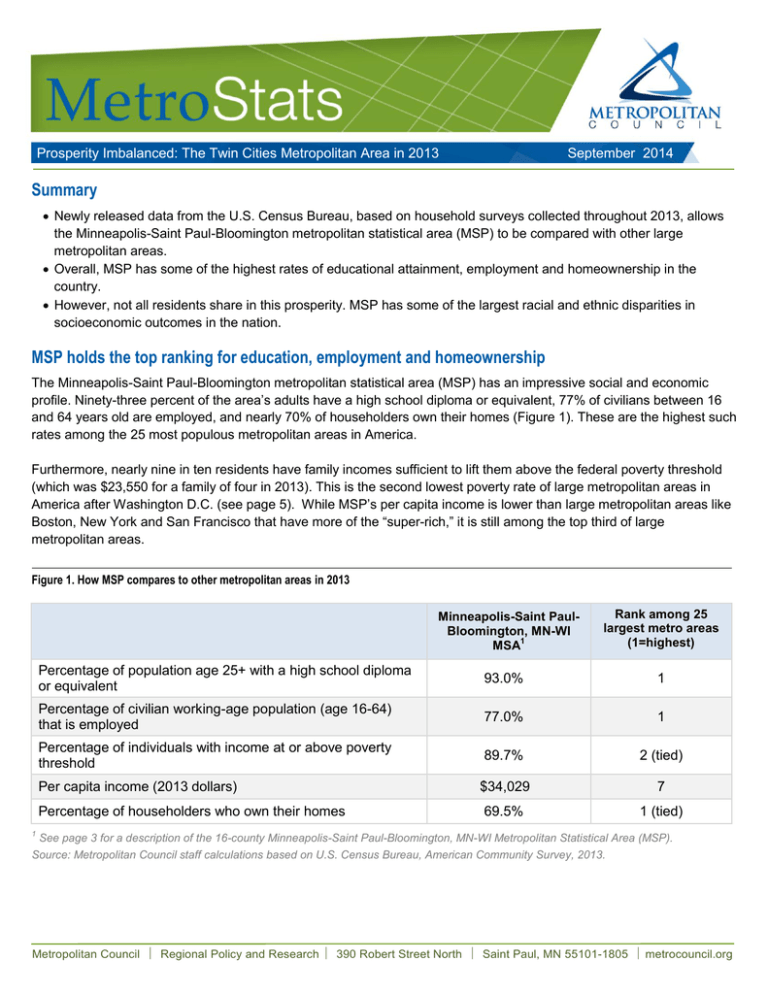
1 Prosperity Imbalanced: The Twin Cities Metropolitan Area in 2013 September 2014 Summary Newly released data from the U.S. Census Bureau, based on household surveys collected throughout 2013, allows the Minneapolis-Saint Paul-Bloomington metropolitan statistical area (MSP) to be compared with other large metropolitan areas. Overall, MSP has some of the highest rates of educational attainment, employment and homeownership in the country. However, not all residents share in this prosperity. MSP has some of the largest racial and ethnic disparities in socioeconomic outcomes in the nation. MSP holds the top ranking for education, employment and homeownership The Minneapolis-Saint Paul-Bloomington metropolitan statistical area (MSP) has an impressive social and economic profile. Ninety-three percent of the area’s adults have a high school diploma or equivalent, 77% of civilians between 16 and 64 years old are employed, and nearly 70% of householders own their homes (Figure 1). These are the highest such rates among the 25 most populous metropolitan areas in America. Furthermore, nearly nine in ten residents have family incomes sufficient to lift them above the federal poverty threshold (which was $23,550 for a family of four in 2013). This is the second lowest poverty rate of large metropolitan areas in America after Washington D.C. (see page 5). While MSP’s per capita income is lower than large metropolitan areas like Boston, New York and San Francisco that have more of the “super-rich,” it is still among the top third of large metropolitan areas. Figure 1. How MSP compares to other metropolitan areas in 2013 Minneapolis-Saint PaulBloomington, MN-WI 1 MSA Rank among 25 largest metro areas (1=highest) Percentage of population age 25+ with a high school diploma or equivalent 93.0% 1 Percentage of civilian working-age population (age 16-64) that is employed 77.0% 1 Percentage of individuals with income at or above poverty threshold 89.7% 2 (tied) $34,029 7 69.5% 1 (tied) Per capita income (2013 dollars) Percentage of householders who own their homes 1 See page 3 for a description of the 16-county Minneapolis-Saint Paul-Bloomington, MN-WI Metropolitan Statistical Area (MSP). Source: Metropolitan Council staff calculations based on U.S. Census Bureau, American Community Survey, 2013. Metropolitan Council Regional Policy and Research 390 Robert Street North Saint Paul, MN 55101-1805 metrocouncil.org 2 2 Prosperity Imbalanced: The Twin Cities Metropolitan Area in 2013 The prosperity of our region is not shared by all While MSP ranks highly on key economic and social indicators, communities of color are not sharing in the area’s prosperity. For example, white non-Latino households in the region are almost twice as likely to own their home as households of color (Figure 2). This is the largest such disparity in homeownership rates across large metro areas in the nation and may be limiting the ability of people of color to generate wealth. Nearly four in five (80%) white, non-Latino civilians of working age are employed, compared with just two of three (67%) working-age civilians of color. In other words, one-third of people of color in their working years are not employed. Whether they are unemployed (looking for a job but unable to find one) or out of the labor force (perhaps they have a disability or have given up on a job search), their income-earning potential is limited. Nearly all white, non-Latino residents (94%) live above the poverty threshold, but just over three-quarters (76%) of residents of color do. Like the disparities in homeownership and employment, this is the largest such gap among the nation’s largest metropolitan areas. The global “persons of color” category masks more sobering statistics among certain racial and ethnic groups. For example, MSP’s black and African American residents have one of the highest poverty rates among the nation’s large metropolitan areas, statistically indistinguishable from the rates in far less prosperous Detroit and Pittsburgh. The Minneapolis-Saint Paul-Bloomington MSA also features the nation’s largest disparity between white, non-Latino and Asian residents in per capita income and the largest disparity between white non-Latino and Latino adults in educational attainment. Figure 2. MSP disparities by race and ethnicity in 2013 White, nonLatino Persons of color Rank of disparity among 25 largest metro areas 1 (1=greatest) Percentage of population age 25+ with a high school diploma or equivalent 96.2% 78.0% 4 Percentage of civilian working-age population (age 16-64) that is employed 79.8% 66.8% 1 Percentage of individuals with income at or above poverty threshold 93.6% 76.2% 1 $38,529 $18,448 4 75.4% 38.7% 1 Per capita income (2013 dollars) Percentage of householders who own their homes 1 Disparities are measured by the ratio of per capita incomes and the odds ratio for all other indicators. For more information, see Appendix A of http://metrocouncil.org/Planning/Projects/Thrive-2040/Choice-Place-and-Opportunity/FHEA/CPO-Appendices.aspx. Source: Metropolitan Council staff calculations based on U.S. Census Bureau, American Community Survey, 2013. For more information about this report, contact us at research@metc.state.mn.us Metropolitan Council Regional Policy and Research 390 Robert Street North Saint Paul, MN 55101-1805 metrocouncil.org 3 3 Prosperity Imbalanced: The Twin Cities Metropolitan Area in 2013 Appendix A: The Minneapolis-Saint Paul-Bloomington, MN-WI Metropolitan Statistical Area The United States Office of Management and Budget groups counties into metropolitan statistical areas (MSAs) based primarily on economic ties as measured by commuting patterns. Where a large proportion of workers in one county reside in another county, those two counties will tend to be grouped into the same MSA. The 2013 American Community Survey is the first to use the new metropolitan statistical areas defined in 2013. Under this definition, the Minneapolis-Saint Paul-Bloomington MSA includes 16 counties—the core seven counties under the Metropolitan Council’s jurisdiction (Anoka, Carver, Dakota, Hennepin, Ramsey, Scott, and Washington Counties in Minnesota) plus nine other counties not under the Council’s jurisdiction (Chisago, Isanti, Le Sueur, Mille Lacs, Sherburne, Sibley, and Wright Counties in Minnesota and Pierce and St. Croix Counties in Wisconsin). Le Sueur, Mille Lacs, and Sibley Counties were not included in the previous definition of the Minneapolis-Saint Paul-Bloomington MSA. Although the new Minneapolis-Saint Paul-Bloomington MSA is larger than the previous MSA, the vast majority of MSA residents live in the core seven-county Twin Cities region under both definitions. Figure A1. Minneapolis-Saint Paul-Bloomington, MN-WI Metropolitan Statistical Area in 2009 and 2013 Number of counties Total area Population (2013 estimate by U.S. Census Bureau) Percentage of population in seven-county Twin Cities region Previous MSA (2009 definition) Current MSA (2013 definition) 13 16 6,364 square miles 8,120 square miles 3,390,431 3,459,146 87% 85% Metropolitan Council Regional Policy and Research 390 Robert Street North Saint Paul, MN 55101-1805 metrocouncil.org 4 4 Prosperity Imbalanced: The Twin Cities Metropolitan Area in 2013 All residents age 25+ White, non-Latino All people of color Black or African American Hispanic or Latino Asian Native American Appendix B-1: Percentage of population age 25+ with high school diploma or equivalent Atlanta-Sandy Springs-Roswell, GA 88.2% 92.3% 83.4% 88.8% 59.4% 86.6% 83.7% Baltimore-Columbia-Towson, MD 89.5% 92.1% 85.0% 85.5% 75.8% 87.0% N/A Boston-Cambridge-Newton, MA-NH 91.2% 94.7% 79.7% 81.5% 69.8% 86.7% 85.6% Charlotte-Concord-Gastonia, NC-SC 86.9% 90.6% 79.2% 84.7% 59.3% 85.4% 73.7% Chicago-Naperville-Elgin, IL-IN-WI 87.2% 94.3% 76.8% 86.0% 62.4% 91.1% 80.0% Dallas-Fort Worth-Arlington, TX 84.4% 94.3% 72.3% 89.2% 55.8% 88.9% 80.5% Denver-Aurora-Lakewood, CO 90.1% 96.3% 75.2% 89.2% 66.7% 85.9% 84.2% Detroit-Warren-Dearborn, MI 88.6% 90.6% 83.5% 84.5% 69.5% 89.3% 82.6% Houston-The Woodlands-Sugar Land, TX 82.0% 94.4% 72.5% 88.4% 59.4% 88.1% 70.3% Los Angeles-Long Beach-Anaheim, CA 78.6% 94.6% 69.8% 87.9% 57.7% 87.4% 68.6% Miami-Fort Lauderdale-West Palm Beach, FL 84.7% 93.8% 79.4% 80.4% 78.2% 86.8% 85.2% Minneapolis-Saint Paul-Bloomington, MN-WI 93.0% 96.2% 78.0% 81.7% 64.8% 80.9% 81.3% New York-Newark-Jersey City, NY-NJ-PA 85.3% 93.2% 76.9% 83.1% 68.2% 82.9% 70.1% Philadelphia-Camden-Wilmington, PA-NJ-DE-MD 89.5% 93.2% 81.6% 85.0% 68.8% 83.0% 89.0% Phoenix-Mesa-Scottsdale, AZ 86.5% 94.9% 70.9% 87.4% 63.0% 87.3% 77.4% Pittsburgh, PA 92.5% 92.9% 88.6% 88.6% 86.0% 90.4% N/A Portland-Vancouver-Hillsboro, OR-WA 90.8% 94.6% 75.8% 85.2% 62.2% 82.3% 83.6% Riverside-San Bernardino-Ontario, CA 79.6% 92.0% 70.7% 89.7% 63.2% 89.9% 76.6% San Antonio-New Braunfels, TX 84.2% 95.2% 76.8% 90.7% 74.2% 84.3% 85.2% San Diego-Carlsbad, CA 85.5% 95.0% 74.8% 89.1% 65.0% 87.7% 72.1% San Francisco-Oakland-Hayward, CA 88.1% 96.6% 81.0% 89.5% 68.6% 85.9% 82.9% Seattle-Tacoma-Bellevue, WA 91.7% 94.9% 83.7% 87.8% 70.9% 86.5% 83.2% St. Louis, MO-IL 90.9% 92.7% 84.4% 84.4% 78.7% 89.7% 74.4% Tampa-St. Petersburg-Clearwater, FL 88.3% 91.2% 81.1% 83.9% 77.1% 86.2% 85.8% Washington-Arlington-Alexandria, DC-VA-MD-WV 90.5% 96.2% 84.7% 90.0% 68.2% 90.6% 92.8% 1 T-2 14 T-21 T-14 T-24 N/A 86.6% 91.7% 76.3% 83.7% 64.7% 86.2% 79.4% Rank of MSP (by positive) United States Note: These numbers are estimated from a sample of households, so margins of error exist around the estimates. The rankings account for this statistical uncertainty. For example, if the Minneapolis-Saint Paul-Bloomington metropolitan area is statistically different from another metropolitan area with 90% confidence, then it receives a higher (or lower) ranking. A rank preceded by “T” (e.g., T-2) indicates a statistical tie. In most cases, margins of error for estimates of Native Americans’ characteristics are too wide to rank metropolitan areas reliably. Metropolitan Council Regional Policy and Research 390 Robert Street North Saint Paul, MN 55101-1805 metrocouncil.org 5 5 Prosperity Imbalanced: The Twin Cities Metropolitan Area in 2013 All civilians age 16 to 64 White, non-Latino All people of color Black or African American Hispanic or Latino Asian Native American Appendix B-2: Percentage of civilians age 16 to 64 who are employed Atlanta-Sandy Springs-Roswell, GA 67.3% 70.1% 64.6% 63.7% 68.0% 65.8% 52.4% Baltimore-Columbia-Towson, MD 71.3% 74.9% 66.3% 64.8% 70.6% 71.1% N/A Boston-Cambridge-Newton, MA-NH 73.3% 75.2% 68.0% 66.6% 67.1% 69.8% N/A Charlotte-Concord-Gastonia, NC-SC 69.4% 71.4% 65.9% 63.6% 70.7% 68.4% N/A Chicago-Naperville-Elgin, IL-IN-WI 68.9% 74.5% 62.2% 53.4% 67.0% 69.5% 60.6% Dallas-Fort Worth-Arlington, TX 71.1% 73.9% 68.3% 65.6% 69.8% 69.6% 60.3% Denver-Aurora-Lakewood, CO 73.3% 75.9% 68.2% 65.5% 67.8% 70.8% 65.6% Detroit-Warren-Dearborn, MI 65.2% 69.6% 56.2% 52.7% 64.4% 67.8% 51.7% Houston-The Woodlands-Sugar Land, TX 68.7% 71.2% 67.1% 63.7% 68.3% 70.2% 65.5% Los Angeles-Long Beach-Anaheim, CA 66.0% 69.8% 64.3% 56.9% 64.5% 67.1% 59.8% Miami-Fort Lauderdale-West Palm Beach, FL 67.2% 70.2% 65.9% 60.3% 68.4% 67.9% N/A Minneapolis-Saint Paul-Bloomington, MN-WI 77.0% 79.8% 66.8% 61.2% 73.0% 70.2% 56.0% New York-Newark-Jersey City, NY-NJ-PA 67.8% 72.0% 64.1% 60.9% 64.7% 67.6% 57.1% Philadelphia-Camden-Wilmington, PA-NJ-DE-MD 68.0% 72.6% 60.0% 57.9% 60.1% 66.4% 67.9% Phoenix-Mesa-Scottsdale, AZ 65.9% 69.7% 60.9% 60.8% 60.4% 69.6% 53.8% Pittsburgh, PA 70.1% 71.7% 60.0% 56.4% 69.1% 66.6% N/A Portland-Vancouver-Hillsboro, OR-WA 69.4% 70.2% 66.6% 58.9% 70.2% 68.3% 54.2% Riverside-San Bernardino-Ontario, CA 59.7% 62.4% 58.3% 51.1% 59.0% 63.2% 49.1% San Antonio-New Braunfels, TX 67.9% 71.4% 66.0% 64.8% 66.1% 65.8% N/A San Diego-Carlsbad, CA 65.3% 67.6% 63.2% 56.5% 63.1% 67.3% 45.1% San Francisco-Oakland-Hayward, CA 70.6% 74.4% 67.9% 55.8% 69.9% 70.6% 60.1% Seattle-Tacoma-Bellevue, WA 70.7% 72.8% 66.3% 61.6% 68.8% 68.1% 61.7% St. Louis, MO-IL 70.5% 74.1% 59.7% 56.9% 67.5% 67.7% N/A Tampa-St. Petersburg-Clearwater, FL 66.7% 68.2% 63.9% 59.9% 66.2% 67.6% 52.7% Washington-Arlington-Alexandria, DC-VA-MD-WV 74.3% 76.9% 72.0% 68.7% 77.3% 73.8% 72.1% 1 1 T-6 T-10 2 T-2 N/A 67.2% 70.0% 62.5% 58.0% 64.9% 67.5% 53.5% Rank of MSP (by positive) United States Note: These numbers are estimated from a sample of households, so margins of error exist around the estimates. The rankings account for this statistical uncertainty. For example, if the Minneapolis-Saint Paul-Bloomington metropolitan area is statistically different from another metropolitan area with 90% confidence, then it receives a higher (or lower) ranking. A rank preceded by “T” (e.g., T-2) indicates a statistical tie. In most cases, margins of error for estimates of Native Americans’ characteristics are too wide to rank metropolitan areas reliably. Metropolitan Council Regional Policy and Research 390 Robert Street North Saint Paul, MN 55101-1805 metrocouncil.org 6 6 Prosperity Imbalanced: The Twin Cities Metropolitan Area in 2013 All residents White, non-Latino All people of color Black or African American Hispanic or Latino Asian Native American Appendix B-3: Percentage of people with family incomes at or above poverty threshold Atlanta-Sandy Springs-Roswell, GA 84.1% 90.6% 77.6% 78.3% 70.9% 85.8% 82.6% Baltimore-Columbia-Towson, MD 88.8% 93.4% 82.3% 80.9% 84.0% 87.5% 59.9% Boston-Cambridge-Newton, MA-NH 89.6% 92.9% 80.3% 80.1% 75.0% 85.7% N/A Charlotte-Concord-Gastonia, NC-SC 85.2% 90.4% 76.3% 75.1% 73.9% 86.6% 76.9% Chicago-Naperville-Elgin, IL-IN-WI 85.6% 92.7% 77.3% 69.6% 79.4% 88.7% 79.6% Dallas-Fort Worth-Arlington, TX 85.0% 92.3% 78.1% 76.2% 76.2% 90.1% 74.4% Denver-Aurora-Lakewood, CO 87.9% 92.6% 79.1% 74.8% 77.3% 89.1% 77.6% Detroit-Warren-Dearborn, MI 83.1% 88.8% 71.3% 66.9% 76.6% 89.6% 67.3% Houston-The Woodlands-Sugar Land, TX 83.6% 92.8% 77.9% 77.0% 75.4% 90.4% 83.6% Los Angeles-Long Beach-Anaheim, CA 82.4% 89.9% 79.0% 75.7% 76.2% 87.5% 75.7% Miami-Fort Lauderdale-West Palm Beach, FL 82.3% 89.7% 78.6% 74.7% 79.9% 85.5% 80.7% Minneapolis-Saint Paul-Bloomington, MN-WI 89.7% 93.6% 76.2% 68.7% 77.5% 81.9% 75.5% New York-Newark-Jersey City, NY-NJ-PA 85.4% 92.2% 79.1% 77.9% 76.1% 86.2% 72.9% Philadelphia-Camden-Wilmington, PA-NJ-DE-MD 86.5% 92.5% 76.0% 75.8% 68.0% 84.6% N/A Phoenix-Mesa-Scottsdale, AZ 82.4% 89.9% 72.2% 78.9% 69.1% 85.2% 70.9% Pittsburgh, PA 87.2% 89.7% 70.7% 67.0% 78.3% 79.4% N/A Portland-Vancouver-Hillsboro, OR-WA 86.5% 89.3% 78.0% 70.5% 73.3% 87.2% 68.6% Riverside-San Bernardino-Ontario, CA 81.8% 88.9% 78.0% 72.9% 77.1% 90.3% 75.4% San Antonio-New Braunfels, TX 83.7% 91.7% 79.4% 75.7% 79.1% 89.7% 86.2% San Diego-Carlsbad, CA 84.8% 88.2% 81.7% 79.5% 79.1% 89.2% 81.3% San Francisco-Oakland-Hayward, CA 88.5% 92.8% 85.5% 75.1% 84.1% 89.8% 78.2% Seattle-Tacoma-Bellevue, WA 87.4% 90.7% 80.9% 73.2% 75.1% 87.6% 77.7% St. Louis, MO-IL 87.1% 91.7% 73.6% 69.9% 83.9% 86.3% 68.9% Tampa-St. Petersburg-Clearwater, FL 84.6% 88.3% 77.3% 72.0% 78.0% 87.7% N/A Washington-Arlington-Alexandria, DC-VA-MD-WV 91.5% 94.8% 88.5% 86.4% 88.7% 92.7% N/A T-2 T-2 T-19 T-23 T-5 T-23 N/A 84.2% 88.9% 76.2% 72.4% 75.2% 87.3% 71.1% Rank of MSP (by positive) United States Note: These numbers are estimated from a sample of households, so margins of error exist around the estimates. The rankings account for this statistical uncertainty. For example, if the Minneapolis-Saint Paul-Bloomington metropolitan area is statistically different from another metropolitan area with 90% confidence, then it receives a higher (or lower) ranking. A rank preceded by “T” (e.g., T-2) indicates a statistical tie. In most cases, margins of error for estimates of Native Americans’ characteristics are too wide to rank metropolitan areas reliably. Metropolitan Council Regional Policy and Research 390 Robert Street North Saint Paul, MN 55101-1805 metrocouncil.org 7 7 Prosperity Imbalanced: The Twin Cities Metropolitan Area in 2013 All residents White, non-Latino All people of color Black or African American Hispanic or Latino Asian Native American Appendix B-4: Per capita income Atlanta-Sandy Springs-Roswell, GA $28,450 $37,239 $19,866 $20,371 $14,321 $27,807 $22,009 Baltimore-Columbia-Towson, MD $35,174 $42,189 $25,223 $24,426 $22,781 $36,007 $14,039 Boston-Cambridge-Newton, MA-NH $39,061 $44,238 $24,799 $22,595 $18,834 $36,190 $21,996 Charlotte-Concord-Gastonia, NC-SC $28,003 $33,573 $18,486 $18,860 $14,149 $29,841 $15,319 Chicago-Naperville-Elgin, IL-IN-WI $31,302 $41,176 $19,654 $18,473 $16,400 $34,238 $21,752 Dallas-Fort Worth-Arlington, TX $29,738 $40,650 $19,277 $21,328 $15,203 $33,274 $20,881 Denver-Aurora-Lakewood, CO $33,636 $41,266 $19,381 $21,940 $16,417 $30,201 $23,495 Detroit-Warren-Dearborn, MI $28,080 $32,290 $19,400 $18,099 $16,555 $31,813 $17,338 Houston-The Woodlands-Sugar Land, TX $29,212 $44,072 $20,001 $21,283 $16,476 $34,535 $21,236 Los Angeles-Long Beach-Anaheim, CA $28,994 $48,858 $20,213 $24,032 $15,646 $31,020 $18,220 Miami-Fort Lauderdale-West Palm Beach, FL $26,722 $40,911 $19,679 $16,091 $20,696 $31,254 $25,278 Minneapolis-Saint Paul-Bloomington, MN-WI $34,029 $38,529 $18,448 $16,878 $16,333 $23,958 $20,239 New York-Newark-Jersey City, NY-NJ-PA $35,780 $48,666 $23,867 $22,557 $19,129 $35,924 $19,488 Philadelphia-Camden-Wilmington, PA-NJ-DE-MD $32,400 $39,045 $20,775 $19,830 $16,856 $30,619 $19,135 Phoenix-Mesa-Scottsdale, AZ $26,403 $34,190 $15,861 $19,015 $13,521 $31,284 $15,673 Pittsburgh, PA $29,985 $31,466 $20,594 $17,297 $24,312 $37,114 $30,927 Portland-Vancouver-Hillsboro, OR-WA $30,450 $34,210 $19,013 $19,671 $13,994 $29,753 $16,595 Riverside-San Bernardino-Ontario, CA $22,048 $32,127 $16,687 $19,958 $14,618 $27,895 $20,340 San Antonio-New Braunfels, TX $24,597 $36,531 $18,133 $22,522 $17,090 $27,428 $19,315 San Diego-Carlsbad, CA $30,844 $42,187 $20,767 $24,194 $16,417 $31,639 $20,938 San Francisco-Oakland-Hayward, CA $42,695 $61,679 $29,347 $24,825 $21,159 $39,178 $25,078 Seattle-Tacoma-Bellevue, WA $35,779 $40,995 $25,506 $23,070 $19,399 $33,939 $25,342 St. Louis, MO-IL $29,675 $33,347 $18,916 $16,772 $23,365 $33,429 $20,542 Tampa-St. Petersburg-Clearwater, FL $26,821 $31,088 $18,634 $17,149 $17,872 $30,010 $22,920 Washington-Arlington-Alexandria, DC-VA-MD-WV $42,897 $56,654 $30,479 $31,063 $23,698 $40,281 $34,059 7 T-14 T-16 T-20 T-11 25 N/A $28,184 $33,537 $19,285 $18,756 $16,117 $32,285 $16,777 Rank of MSP (by positive) United States Note: These numbers are estimated from a sample of households, so margins of error exist around the estimates. The rankings account for this statistical uncertainty. For example, if the Minneapolis-Saint Paul-Bloomington metropolitan area is statistically different from another metropolitan area with 90% confidence, then it receives a higher (or lower) ranking. A rank preceded by “T” (e.g., T-2) indicates a statistical tie. In most cases, margins of error for estimates of Native Americans’ characteristics are too wide to rank metropolitan areas reliably. Metropolitan Council Regional Policy and Research 390 Robert Street North Saint Paul, MN 55101-1805 metrocouncil.org 8 8 Prosperity Imbalanced: The Twin Cities Metropolitan Area in 2013 All householders White, non-Latino householders All householders of color Black or African American Hispanic or Latino Asian Native American Appendix B-5: Percentage of householders who own their homes Atlanta-Sandy Springs-Roswell, GA 63.3% 75.8% 48.5% 46.9% 42.8% 63.3% 70.2% Baltimore-Columbia-Towson, MD 65.9% 76.5% 48.5% 46.2% 47.5% 62.2% 56.6% Boston-Cambridge-Newton, MA-NH 60.7% 67.8% 35.1% 31.7% 24.5% 49.9% 41.9% Charlotte-Concord-Gastonia, NC-SC 65.0% 74.1% 45.7% 43.9% 42.9% 58.1% 57.1% Chicago-Naperville-Elgin, IL-IN-WI 64.1% 74.3% 47.6% 39.4% 51.4% 61.4% 60.9% Dallas-Fort Worth-Arlington, TX 59.5% 69.2% 46.7% 38.7% 50.0% 59.0% 58.4% Denver-Aurora-Lakewood, CO 63.5% 69.8% 46.2% 38.9% 44.7% 63.6% 53.7% Detroit-Warren-Dearborn, MI 68.6% 77.2% 48.2% 43.8% 61.5% 63.4% 63.2% Houston-The Woodlands-Sugar Land, TX 60.1% 71.2% 50.8% 41.6% 52.3% 67.8% 51.5% Los Angeles-Long Beach-Anaheim, CA 48.3% 58.3% 41.5% 32.9% 37.7% 54.8% 39.4% Miami-Fort Lauderdale-West Palm Beach, FL 60.7% 73.7% 51.3% 44.9% 52.6% 69.2% 46.8% Minneapolis-Saint Paul-Bloomington, MN-WI 69.5% 75.4% 38.7% 26.3% 40.9% 55.1% 40.6% New York-Newark-Jersey City, NY-NJ-PA 51.6% 66.3% 34.2% 32.0% 26.5% 51.4% 36.4% Philadelphia-Camden-Wilmington, PA-NJ-DE-MD 66.9% 75.5% 48.8% 47.3% 43.3% 60.8% 54.7% Phoenix-Mesa-Scottsdale, AZ 61.0% 68.7% 44.5% 31.5% 44.9% 58.8% 40.9% Pittsburgh, PA 69.8% 73.7% 40.1% 37.3% 48.4% 42.7% 52.0% Portland-Vancouver-Hillsboro, OR-WA 60.3% 64.0% 44.1% 39.7% 33.3% 62.9% 43.8% Riverside-San Bernardino-Ontario, CA 61.9% 70.4% 54.5% 40.9% 55.3% 68.4% 49.3% San Antonio-New Braunfels, TX 61.4% 70.4% 54.7% 40.8% 56.9% 49.4% 50.7% San Diego-Carlsbad, CA 52.8% 60.4% 42.1% 30.1% 38.6% 56.2% 41.6% San Francisco-Oakland-Hayward, CA 53.6% 60.9% 46.0% 30.8% 38.5% 58.8% 39.9% Seattle-Tacoma-Bellevue, WA 59.1% 64.7% 44.1% 28.3% 35.6% 58.1% 39.8% St. Louis, MO-IL 69.6% 76.8% 44.8% 42.4% 56.5% 51.3% 56.4% Tampa-St. Petersburg-Clearwater, FL 63.4% 70.1% 46.1% 36.6% 49.4% 67.5% 73.9% Washington-Arlington-Alexandria, DC-VA-MD-WV 62.7% 72.2% 51.7% 49.2% 45.4% 66.4% 53.5% T-1 T-4 23 T-24 T-14 T-16 T-16 63.5% 71.1% 46.2% 41.9% 45.2% 57.8% 54.2% Rank of MSP (by positive) United States Note: These numbers are estimated from a sample of households, so margins of error exist around the estimates. The rankings account for this statistical uncertainty. For example, if the Minneapolis-Saint Paul-Bloomington metropolitan area is statistically different from another metropolitan area with 90% confidence, then it receives a higher (or lower) ranking. A rank preceded by “T” (e.g., T-2) indicates a statistical tie. In most cases, margins of error for estimates of Native Americans’ characteristics are too wide to rank metropolitan areas reliably. Metropolitan Council Regional Policy and Research 390 Robert Street North Saint Paul, MN 55101-1805 metrocouncil.org
