Over the past three decades China`s economy has moved from
advertisement

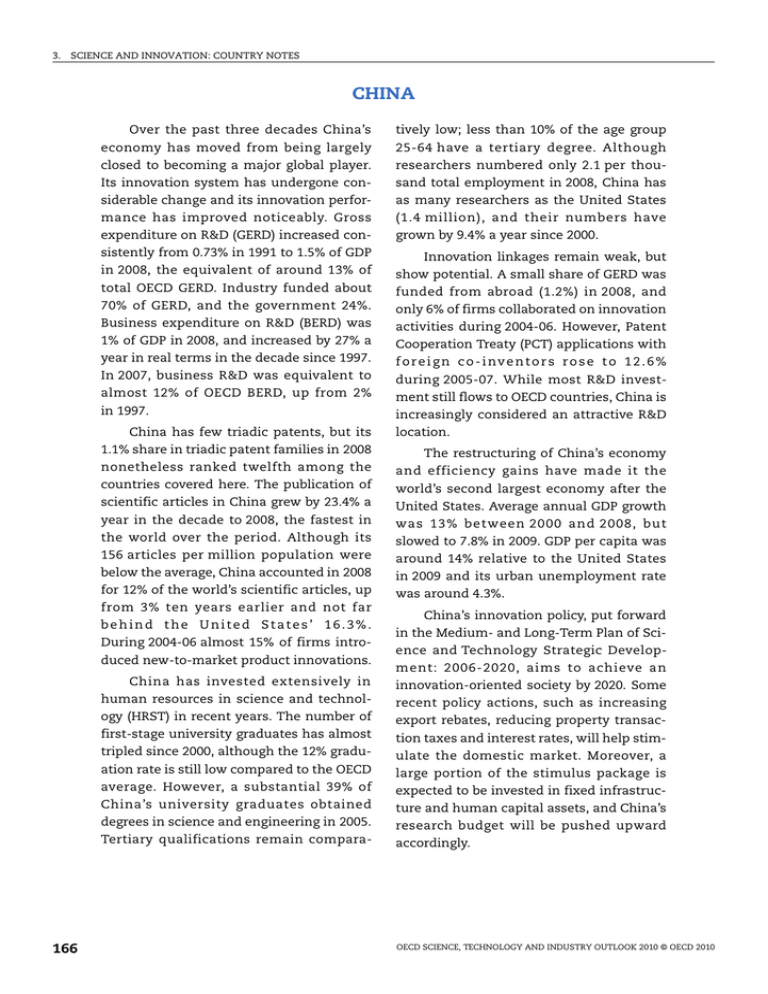
3. SCIENCE AND INNOVATION: COUNTRY NOTES CHINA Over the past three decades China’s economy has moved from being largely closed to becoming a major global player. Its innovation system has undergone considerable change and its innovation performance has improved noticeably. Gross expenditure on R&D (GERD) increased consistently from 0.73% in 1991 to 1.5% of GDP in 2008, the equivalent of around 13% of total OECD GERD. Industry funded about 70% of GERD, and the government 24%. Business expenditure on R&D (BERD) was tively low; less than 10% of the age group 25-64 have a tertiary degree. Although researchers numbered only 2.1 per thousand total employment in 2008, China has as many researchers as the United States (1.4 million), and their numbers have grown by 9.4% a year since 2000. 1% of GDP in 2008, and increased by 27% a year in real terms in the decade since 1997. In 2007, business R&D was equivalent to almost 12% of OECD BERD, up from 2% in 1997. Cooperation Treaty (PCT) applications with f o r e i g n c o - i nv e n t o r s r o s e t o 1 2 . 6 % during 2005-07. While most R&D investment still flows to OECD countries, China is increasingly considered an attractive R&D location. China has few triadic patents, but its 1.1% share in triadic patent families in 2008 nonetheless ranked twelfth among the countries covered here. The publication of scientific articles in China grew by 23.4% a year in the decade to 2008, the fastest in the world over the period. Although its 156 articles per million population were below the average, China accounted in 2008 for 12% of the world’s scientific articles, up from 3% ten years earlier and not far behind the United States’ 16.3%. During 2004-06 almost 15% of firms introduced new-to-market product innovations. China has invested extensively in human resources in science and technology (HRST) in recent years. The number of first-stage university graduates has almost tripled since 2000, although the 12% graduation rate is still low compared to the OECD average. However, a substantial 39% of China’s university graduates obtained degrees in science and engineering in 2005. Tertiary qualifications remain compara- 166 Innovation linkages remain weak, but show potential. A small share of GERD was funded from abroad (1.2%) in 2008, and only 6% of firms collaborated on innovation activities during 2004-06. However, Patent The restructuring of China’s economy and efficiency gains have made it the world’s second largest economy after the United States. Average annual GDP growth was 13% between 2000 and 2008, but slowed to 7.8% in 2009. GDP per capita was around 14% relative to the United States in 2009 and its urban unemployment rate was around 4.3%. China’s innovation policy, put forward in the Medium- and Long-Term Plan of Science and Technology Strategic Development: 2006-2020, aims to achieve an innovation-oriented society by 2020. Some recent policy actions, such as increasing export rebates, reducing property transaction taxes and interest rates, will help stimulate the domestic market. Moreover, a large portion of the stimulus package is expected to be invested in fixed infrastructure and human capital assets, and China’s research budget will be pushed upward accordingly. OECD SCIENCE, TECHNOLOGY AND INDUSTRY OUTLOOK 2010 © OECD 2010 3. SCIENCE AND INNOVATION: COUNTRY NOTES Science and innovation profile of China China Average GERD as % of GDP % of population aged 25-64 with tertiary degree BERD as % of GDP Science and engineering degrees as % of all new degrees Industry financed GERD as % GDP Triadic patents per million population Researchers per thousand total employment Scientific articles per million population % of GERD financed by abroad % of firms with new-to-market product innovations (as % of all firms) Patents with foreign co-inventors % of firms collaborating (as % of all firms) 1 2 http://dx.doi.org/10.1787/888932333405 % 2.5 Gross expenditure on R&D Science and engineering degrees As a percentage of GDP, 1991-2008 As a percentage of all new degrees, 2007 China % 45 OECD average 40 35 2.0 30 25 1.5 20 15 1.0 10 0.5 5 20 a( in de ra Ch 19 9 19 1 9 19 2 9 19 3 94 19 9 19 5 9 19 6 9 19 7 98 19 9 20 9 0 20 0 0 20 1 0 20 2 0 20 3 0 20 4 0 20 5 0 20 6 0 20 7 08 05 ) t i o Kor ea n (2 00 M 6) ex ic o OE CD J a p av an er ag e So Is ut ra h el Af r i c Ch a ( il e 20 03 Un No ) i te r wa d St y at es Br az il 0 0 Ru ss ia n Fe 1 2 http://dx.doi.org/10.1787/888932333424 1 2 http://dx.doi.org/10.1787/888932333443 OECD SCIENCE, TECHNOLOGY AND INDUSTRY OUTLOOK 2010 © OECD 2010 167


