Predicting the qualitative features of a line
advertisement

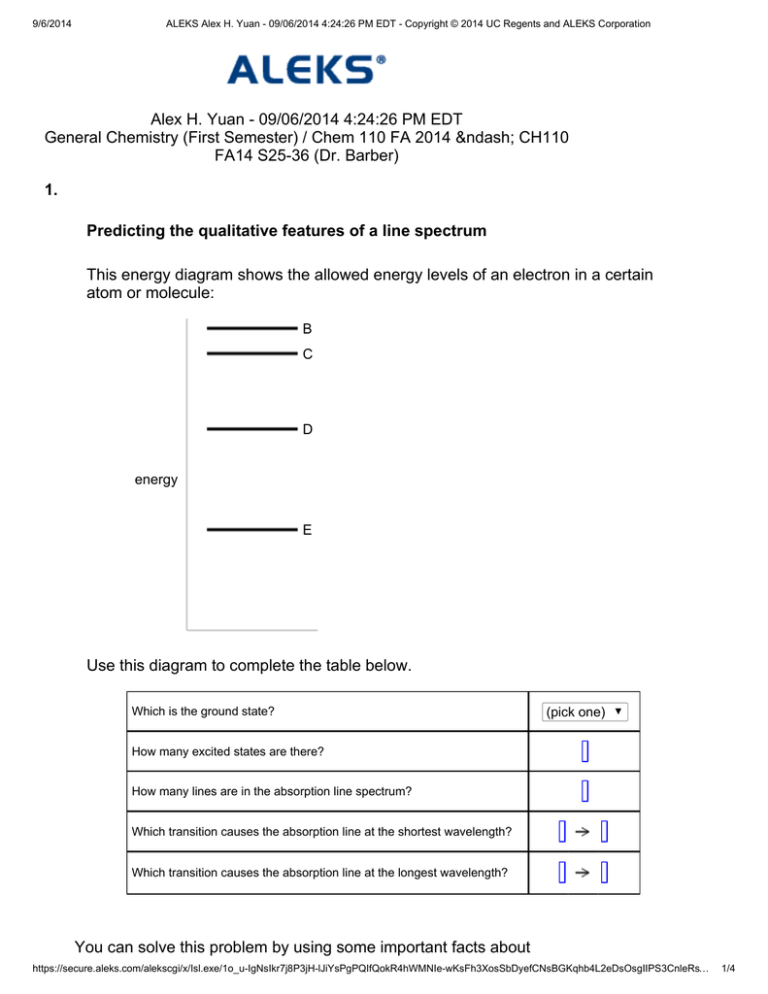
9/6/2014 ALEKS Alex H. Yuan - 09/06/2014 4:24:26 PM EDT - Copyright © 2014 UC Regents and ALEKS Corporation Alex H. Yuan - 09/06/2014 4:24:26 PM EDT General Chemistry (First Semester) / Chem 110 FA 2014 – CH110 FA14 S25-36 (Dr. Barber) 1. Predicting the qualitative features of a line spectrum This energy diagram shows the allowed energy levels of an electron in a certain atom or molecule: B C D energy E Use this diagram to complete the table below. Which is the ground state? (pick one) How many excited states are there? How many lines are in the absorption line spectrum? Which transition causes the absorption line at the shortest wavelength? Which transition causes the absorption line at the longest wavelength? You can solve this problem by using some important facts about spectroscopy. https://secure.aleks.com/alekscgi/x/Isl.exe/1o_u-IgNsIkr7j8P3jH-lJiYsPgPQIfQokR4hWMNIe-wKsFh3XosSbDyefCNsBGKqhb4L2eDsOsgIIPS3CnleRs… 1/4 9/6/2014 ALEKS Alex H. Yuan - 09/06/2014 4:24:26 PM EDT - Copyright © 2014 UC Regents and ALEKS Corporation spectroscopy. First, complete the top two rows of the table by using the fact that the state with the lowest possible energy is called the ground state, and all other states are called excited states. That means the ground state in this problem is E, and there are excited states. Next, use the fact that there's a line in the absorption line spectrum of a system for each possible transition that absorbs energy. For example, for the energy level diagram shown in this problem, there are transitions that start from the lowest state and absorb energy (shown below at left), and transitions that start from the next lowest state and absorb energy (shown below at right): B B C C D D energy energy E E Altogether, if you count carefully, there are transitions that absorb energy. That means there would be absorption line spectrum of this system. lines in the On the other hand, there's a line in the emission line spectrum of a system for each possible transition that releases energy. For example, for the energy level diagram shown in this problem, there are transitions that start from the highest state and release energy (shown below at left), and transitions that start from the next highest state and release energy (shown below at right): https://secure.aleks.com/alekscgi/x/Isl.exe/1o_u-IgNsIkr7j8P3jH-lJiYsPgPQIfQokR4hWMNIe-wKsFh3XosSbDyefCNsBGKqhb4L2eDsOsgIIPS3CnleRs… 2/4 9/6/2014 ALEKS Alex H. Yuan - 09/06/2014 4:24:26 PM EDT - Copyright © 2014 UC Regents and ALEKS Corporation B B C C D D energy energy E E Altogether, if you count carefully, there are release energy. That means there would be emission line spectrum of this system. transitions that lines in the Finally, to complete the last two rows of the column, use the relationship between the energy of a photon and its frequency or wavelength: In this equation the photon, stands for the energy of stands for its frequency, and is the Planck constant. You can derive this equation from the previous line by using the fact that where stands for wavelength and the speed of light. is The first equation tells you that the frequency of a line in the emission or absorption line spectrum is directly proportional to the energy released or absorbed by a transition. On the other hand, the second equation tells you the wavelength of a line is inversely proportional to the energy released or absorbed by a transition. In other words, the line in the absorption or emission spectrum with the longest wavelength will come from the transition that absorbs or releases the least amount of energy. For the energy level diagram shown in this problem, that would be the transition between C and B. https://secure.aleks.com/alekscgi/x/Isl.exe/1o_u-IgNsIkr7j8P3jH-lJiYsPgPQIfQokR4hWMNIe-wKsFh3XosSbDyefCNsBGKqhb4L2eDsOsgIIPS3CnleRs… 3/4 9/6/2014 ALEKS Alex H. Yuan - 09/06/2014 4:24:26 PM EDT - Copyright © 2014 UC Regents and ALEKS Corporation be the transition between C and B. On the other hand, the line in the absorption or emission spectrum with the shortest wavelength will come from the transition that absorbs or releases the most amount of energy. For the energy level diagram shown in this problem, that would be the transition between E and B. Here is the completed table: Which is the ground state? E How many excited states are there? 3 How many lines are in the absorption line spectrum? 6 Which transition causes the absorption line at the shortest wavelength? E B Which transition causes the absorption line at the longest wavelength? C B Copyright © 2014 UC Regents and ALEKS Corporation https://secure.aleks.com/alekscgi/x/Isl.exe/1o_u-IgNsIkr7j8P3jH-lJiYsPgPQIfQokR4hWMNIe-wKsFh3XosSbDyefCNsBGKqhb4L2eDsOsgIIPS3CnleRs… 4/4


