Economic Newsletter for the New Millennium
Don Byrne (dbyrne5628@aol.com); Ed Derbin (edtitan@aol.com)
Price Elasticity of Demand
The relationship of the price to quantity demanded and how it relates
to total revenue is technically called the price and elasticity of demand.
Technically, the percentage change in quantity demanded divided by
the percentage change in the price that caused the change in the
quantity demanded
(QD1 – QD2)/QD1
(P1 – P2) / P1
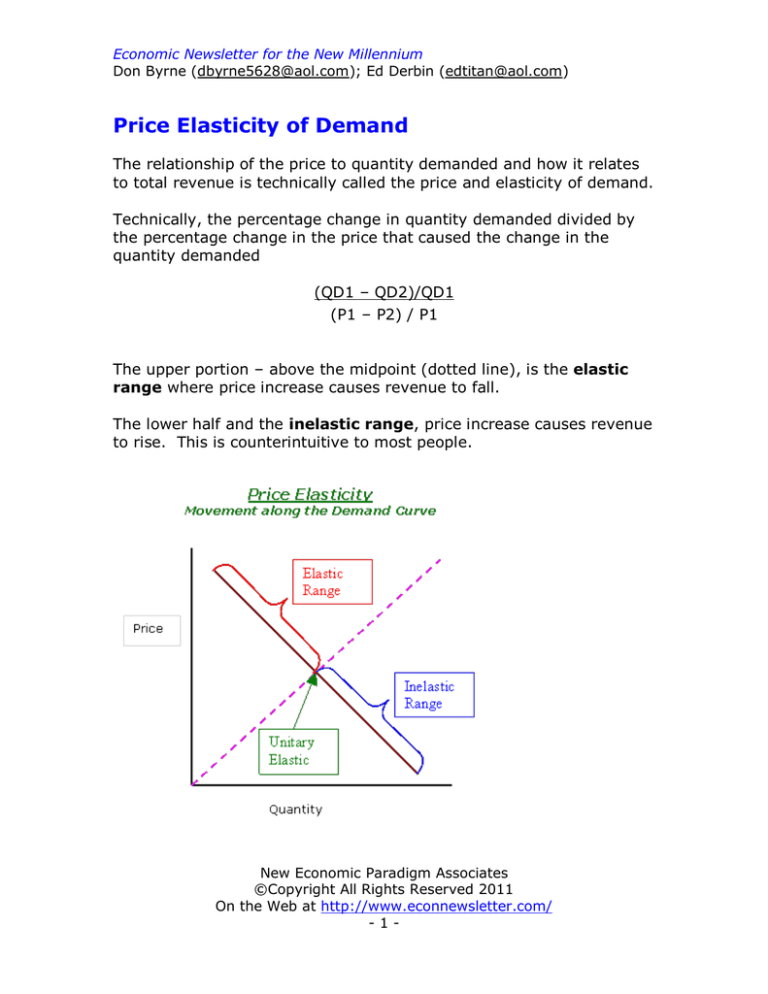
The upper portion – above the midpoint (dotted line), is the elastic
range where price increase causes revenue to fall.
The lower half and the inelastic range, price increase causes revenue
to rise. This is counterintuitive to most people.
New Economic Paradigm Associates
©Copyright All Rights Reserved 2011
On the Web at http://www.econnewsletter.com/
-1-
Economic Newsletter for the New Millennium
Don Byrne (dbyrne5628@aol.com); Ed Derbin (edtitan@aol.com)
Price Elasticity: Movement along the demand curve
Flattening demand curve
Midpoint
/Unitary
Elastic
Elastic
Range
Price
Price
Elastic
Range
Midpoint
/Unitary
Elastic
Inelastic
Range
Quantity
Quantity
Further on Price Elasticity of Demand: Shifting; flattening and/or
steepening; increasing competition, rotating the demand curve to a
flatter position (price elasticity at each price increases)
When demand curve shifts to the right, price elasticity decreases with
each price --- (greater ability to increase revenue with price increase)
New Economic Paradigm Associates
©Copyright All Rights Reserved 2011
On the Web at http://www.econnewsletter.com/
-2-
Economic Newsletter for the New Millennium
Don Byrne (dbyrne5628@aol.com); Ed Derbin (edtitan@aol.com)
Product differentiation (advertising) aims to reduce competition/
substitution effect --- (greater ability to increase revenue with price
increase)
As just explained, the relationship of the price of a good to the
quantity demanded, (QD) of that good is normally negative and thus
has an inverse relationship – when price rises, the quantity demanded
of that good falls and price falls, quantity demanded of that good rises.
The degree to which QD responds to price depends upon substitution
effects & income effects. As we saw, most goods are normal, so more
often than not, the income effect does reinforce the substitution effect.
TR = P X QD
The total revenue a firm receives from selling a product depends upon
the product of Price times Quantity Demanded (P X QD)…price times
quantity demanded equals revenue (P X QD = Revenue). Now you
have to stop and pause and think about this.
… All else equal (ceteris paribus),
Profits = Revenue – Expense (cost)
When revenue rises, profits rise
When revenue falls, profits fall
…ignoring cost for the moment…
Again, technically, the percentage change in quantity demanded
divided by the percentage change in the price that caused the change
in the quantity demanded
(QD1 – QD2)/QD1
(P1 – P2) / P1
Note: In other words we have to rule out all the factors that influence
the quantity demanded. If we don’t, then we don’t have price elasticity
of demand – that has to be understood.
So if you are trying to do this in real life – measure price elasticity, you
would have to have complicated statistical routines which were able to
mute the effects of all the changes that influence quantity demanded
New Economic Paradigm Associates
©Copyright All Rights Reserved 2011
On the Web at http://www.econnewsletter.com/
-3-
Economic Newsletter for the New Millennium
Don Byrne (dbyrne5628@aol.com); Ed Derbin (edtitan@aol.com)
other than the price of that good itself.
Average Revenue (top) and Total Revenue (bottom)
$3
Midpoint/Unitary
Elastic Price
Price
$2
Demand = Average
Revenue / Price Line
$1
1
2
3
Quantity Demanded
Total
Revenue
Thousands
$40
Total Revenue
=0
$30
10,000
30,000
20,000
Quantity Demanded
Using the above illustration…Starting with the top picture (Average Revenue/Demand
Curve) – from a rate of $1…moving up to $2, the quantity demanded moves from 30,000
classes to 20,000. In looking at the Total Revenue picture below, you find that the
movement, in spite of the drop in quantity demanded, still translates into greater
revenues (from total revenue of $30,000 to $40,000).
However, if you continue to raise prices higher (past the Midpoint/Unitary Elastic point
shown above), your revenue will fall (going from total revenue of $40,000 to $30,000).
New Economic Paradigm Associates
©Copyright All Rights Reserved 2011
On the Web at http://www.econnewsletter.com/
-4-
Economic Newsletter for the New Millennium
Don Byrne (dbyrne5628@aol.com); Ed Derbin (edtitan@aol.com)
Marginal Revenue
Marginal revenue is the incremental revenue as the quantity sold
changes by one unit.
Marginal
Revenue = 4
Marginal Revenue
4
Price at the
Midpoint
3
Price
2
Demand = Average
Revenue / Price Line
1
1
2
3
Quantity Demanded
Marginal
Revenue = 0
Marginal
Revenue = -4
New Economic Paradigm Associates
©Copyright All Rights Reserved 2011
On the Web at http://www.econnewsletter.com/
-5-
Economic Newsletter for the New Millennium
Don Byrne (dbyrne5628@aol.com); Ed Derbin (edtitan@aol.com)
Substitution Effect (competition and its effect)
In flattening, the demand curve becomes more price elastic at each
price (see figure below: movement from D1 to D2).
Competition increases, at a given price, demand becomes more price
elastic at each price.
If the price elasticity increases to such an extent, that what was
formerly price inelastic is now price elastic, an increase in price will
cause a fall in revenue.
Flattening Demand
Curve: Resistance
to price hikes
Price
D2
D1
Quantity
New Economic Paradigm Associates
©Copyright All Rights Reserved 2011
On the Web at http://www.econnewsletter.com/
-6-
Economic Newsletter for the New Millennium
Don Byrne (dbyrne5628@aol.com); Ed Derbin (edtitan@aol.com)
Price Elasticity in Demand (when demand shifts)
When demand increases, more or less a parallel shift, price elasticity
demand decreases and price increases in that range are more revenue
enhancing.
So, if the good in question is a normal good, and income is rising, it is
going to shift the demand curve to the right.
Demand Shift: (Rightward) Decreases
Price Elasticity of Demand (price increase
more revenue enhancing)
New
Midpoint
Price
per
bott
Old
Midpoint
D1
D2
Quantity
New Economic Paradigm Associates
©Copyright All Rights Reserved 2011
On the Web at http://www.econnewsletter.com/
-7-
Economic Newsletter for the New Millennium
Don Byrne (dbyrne5628@aol.com); Ed Derbin (edtitan@aol.com)
Change in Quantity Demanded
Now we should stop here and point out when we say the demand
curve we are talking about the relationship of the price of that
good to the quantity and demand of that good, everything else
held constant (see figure: higher price…movement from QD1 to QD2).
Change in Quantity Demand:
movement along the demand curve
Price
per
bott
QD
2
QD
1
Quantity
New Economic Paradigm Associates
©Copyright All Rights Reserved 2011
On the Web at http://www.econnewsletter.com/
-8-
Economic Newsletter for the New Millennium
Don Byrne (dbyrne5628@aol.com); Ed Derbin (edtitan@aol.com)
Shift in the Demand Curve
If it is a normal good and income rises, it will cause the demand curve
to shift rightward (higher income: shift in demand D1 to D2).
Changes in income, population distribution, wealth, etc., change (shift)
demand the demand curve, not just quantity demanded.
Demand Shift for Normal Good:
(Rightward) higher income
Price
per
bott
D1
D2
Quantity
The aim of advertising is to reduce the substitution effect; thereby
causing the demand curve to become steeper or more parallel to the
price axis, and thus reduces price elasticity demand of each price (this
is the opposite of what we saw earlier).
New Economic Paradigm Associates
©Copyright All Rights Reserved 2011
On the Web at http://www.econnewsletter.com/
-9-
Economic Newsletter for the New Millennium
Don Byrne (dbyrne5628@aol.com); Ed Derbin (edtitan@aol.com)
Advertising – Steepened
Demand Curve promoting
higher profits
Price
Assumption: operating in the
inelastic range (price
increases are revenue
enhancing
D1
D2
Quantity
Summary (Price Elasticity of Demand)
So we have several reasons why price elasticity can change, one is
that when you move along the demand curve (almost all the demand
curves, linear and curvilinear up to a point where they become
hyperbolic), it means that you change the price; price elasticity
decreases because you go down the demand curve and increases as
you go up.
Starting from the quantity axis (X-axis) you go through an inelastic
range, where a price increase causes revenue to rise but at a
decreasing rate. You reach the midpoint where price elasticity is
unitary (or one), where price increases in that narrow range (or
decreases) do not change the revenue. Then into the upper half of the
demand curve (be it a linear curve or curvilinear), where price
increases cause total revenue to fall. That’s the basic concept of price
elasticity for a given demand curve.
Further on Price Elasticity of Demand: Shifting; flattening
and/or steepening
New Economic Paradigm Associates
©Copyright All Rights Reserved 2011
On the Web at http://www.econnewsletter.com/
- 10 -
Economic Newsletter for the New Millennium
Don Byrne (dbyrne5628@aol.com); Ed Derbin (edtitan@aol.com)
When competition increases, rotating the demand curve to a flatter
position, price elasticity at each price increases
When demand curve shifts to the right, price elasticity decreases
with each price
Product differentiation (advertising) is, in effect, a reduction in
competition, reducing the substitution effect; convincing people that
other goods are not as substitutable and that causes the curve to
rotate and become steeper and more parallel to the price axis
This is extremely important because the basic business decision
to know what to produce, how much to produce, when to
expand, when to contract production, etc., depends upon the
relationship of revenue, cost, and profits (Profit = Revenue – cost)
New Economic Paradigm Associates
©Copyright All Rights Reserved 2011
On the Web at http://www.econnewsletter.com/
- 11 -


