IMPROVED SPEAKER RECOGNITION USING DCT COEFFICIENTS
advertisement

IMPROVED SPEAKER RECOGNITION USING DCT COEFFICIENTS AS FEATURES
Mitchell McLaren, Yun Lei
Speech Technology and Research Laboratory, SRI International, California, USA
{mitch,yunlei}@speech.sri.com
ABSTRACT
We recently proposed the use of coefficients extracted from the 2D
discrete cosine transform (DCT) of log Mel filter bank energies to
improve speaker recognition over the traditional Mel frequency cepstral coefficients (MFCC) with appended deltas and double deltas
(MFCC/deltas). Selection of relevant coefficients was shown to be
crucial, resulting in the proposal of a zig-zag parsing strategy. While
2D-DCT coefficients provided significant gains over MFCC/deltas,
the parsing strategy remains sensitive to the number of filter bank
outputs and the analysis window size. In this work, we analyze this
sensitivity and propose two new data-driven methods of utilizing
DCT coefficients for speaker recognition: rankDCT and pcaDCT.
The first, rankDCT, is an automated coefficient selection strategy
based on the highest average intra-frame energy rank. The alternate
method, pcaDCT, avoids the need for selection and instead projects
DCT coefficients to the desired dimensionality via Principal Component Analysis (PCA). All features including MFCC/deltas are tuned
on a subset of the PRISM database to subsequently highlight any parameter sensitivities of each feature. Evaluated on the recent NIST
SRE’12 corpus, pcaDCT consistently outperforms both rankDCT
and zzDCT features and offers an average 20% relative improvement
over MFCC/deltas across conditions.
Index Terms— Contextualization, Deltas, 2D-DCT, Filterbank
Energies, Speaker Recognition, DNN i-vector
1. INTRODUCTION
Mel frequency cepstral coefficients (MFCCs) with appended deltas
and double deltas (referred to as MFCC/deltas in this work) have
been used extensively throughout speaker recognition research for
the last few decades [1]. The appending of deltas to the raw MFCC
aims to capture the dynamics of speech by providing context to
the frame. With regard to speaker recognition, this contextualization provides an improvement of around 20% relative [2]. We recently proposed to replace the common MFCCs/delta configuration
with a well-defined set of 2D-DCT coefficients, termed zig-zag DCT
(zzDCT) [2].
ZzDCT features [2] are a subset of coefficients from the 2DDCT of log Mel filter bank energies, selected using a zig-zag parsing strategy. These features outperformed MFCC/deltas by up to
This material is based on work supported by the Defense Advanced Research Projects Agency (DARPA) under Contract D10PC20024 and a development contract with Sandia National Laboratories (SNL) (#DE-AC0494AL85000). Any opinions, findings, and conclusions or recommendations
expressed in this material are those of the author(s) and do not necessarily
reflect the view of SNL, nor DARPA or its contracting agent, the U.S. Department of the Interior, National Business Center, Acquisition & Property
Management Division, Southwest Branch. “A” (Approved for Public Release, Distribution Unlimited).
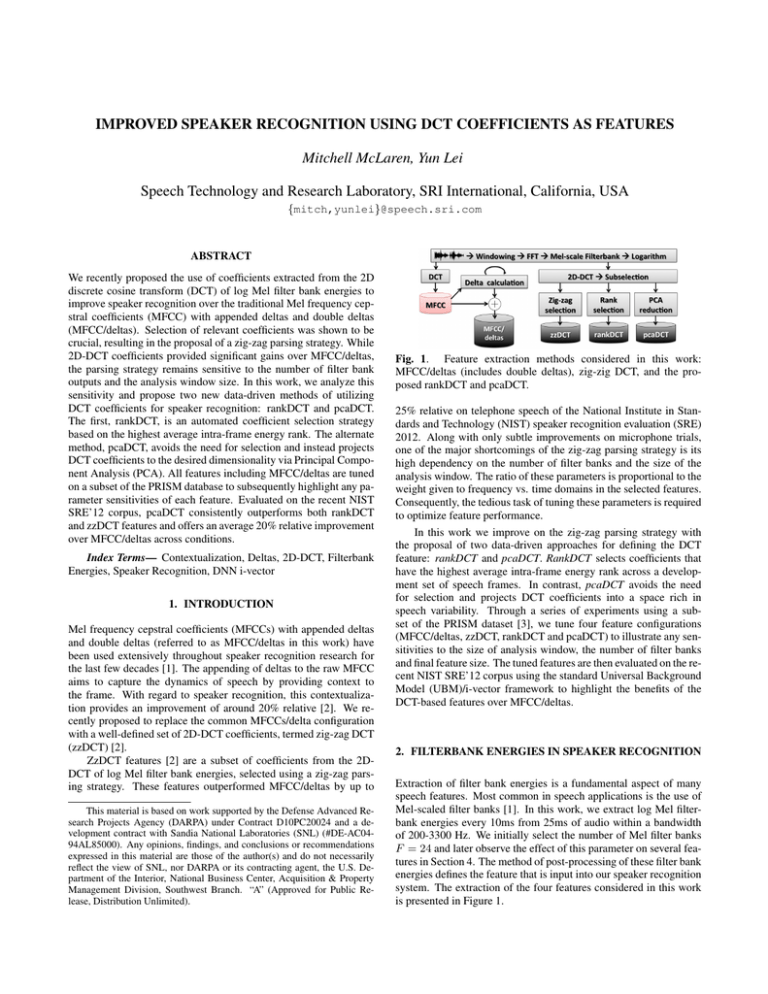
Fig. 1. Feature extraction methods considered in this work:
MFCC/deltas (includes double deltas), zig-zig DCT, and the proposed rankDCT and pcaDCT.
25% relative on telephone speech of the National Institute in Standards and Technology (NIST) speaker recognition evaluation (SRE)
2012. Along with only subtle improvements on microphone trials,
one of the major shortcomings of the zig-zag parsing strategy is its
high dependency on the number of filter banks and the size of the
analysis window. The ratio of these parameters is proportional to the
weight given to frequency vs. time domains in the selected features.
Consequently, the tedious task of tuning these parameters is required
to optimize feature performance.
In this work we improve on the zig-zag parsing strategy with
the proposal of two data-driven approaches for defining the DCT
feature: rankDCT and pcaDCT. RankDCT selects coefficients that
have the highest average intra-frame energy rank across a development set of speech frames. In contrast, pcaDCT avoids the need
for selection and projects DCT coefficients into a space rich in
speech variability. Through a series of experiments using a subset of the PRISM dataset [3], we tune four feature configurations
(MFCC/deltas, zzDCT, rankDCT and pcaDCT) to illustrate any sensitivities to the size of analysis window, the number of filter banks
and final feature size. The tuned features are then evaluated on the recent NIST SRE’12 corpus using the standard Universal Background
Model (UBM)/i-vector framework to highlight the benefits of the
DCT-based features over MFCC/deltas.
2. FILTERBANK ENERGIES IN SPEAKER RECOGNITION
Extraction of filter bank energies is a fundamental aspect of many
speech features. Most common in speech applications is the use of
Mel-scaled filter banks [1]. In this work, we extract log Mel filterbank energies every 10ms from 25ms of audio within a bandwidth
of 200-3300 Hz. We initially select the number of Mel filter banks
F = 24 and later observe the effect of this parameter on several features in Section 4. The method of post-processing of these filter bank
energies defines the feature that is input into our speaker recognition
system. The extraction of the four features considered in this work
is presented in Figure 1.
2.1. MFCCs with appended deltas
Conversion of the log Mel filter bank energies to MFCCs involves
taking the DCT with respect to the frequency domain, i.e., across
the filter bank outputs independently for each frame. Typically, a
subset of the first 20 of F coefficients (often excluding c0) are selected as the feature. Contextualizing MFCCs for speaker recognition typically involves appending deltas and double deltas, resulting in 60-dimensional features. Computing deltas involves using an
analysis window of W frames, from which the dynamic nature of
the feature is extracted from the time domain. In [2], we compared
different methods of delta computation where the best method was
to use a filter defined by [-0.25, -0.5, -0.25, 0, 0, 0, 0.25, 0.5, 0.25].
In this case, W = 9; longer windows in Section 4 were obtained by
inserting zeros at the center point of the window.
Fig. 2. Dark blocks indicate the 60 indices of the 2D-DCT coefficients selected based on the zig-zag parsing strategy after subselecting (area bounded by a red line) the 2D-DCT matrix.
2.2. 2D-DCT of Log Mel Filterbank Energies
In [2] we proposed the contextualizing of log Mel filter bank energies
directly using coefficients of the 2D-DCT for speaker recognition.
In these features, neither MFCCs nor deltas were explicitly computed. The F × W 2D-DCT of log Mel filter banks is first computed
across both frequency and time, and the time axis is processed using
a sliding window of W frames1 . As shown in our previous work,
the method used to sub-select N coefficients from the 2D-DCT was
paramount in obtaining good speaker recognition performance.
In each of the following approaches, we found that sub-selection
of the 2D-DCT matrix, performed by skipping the first column in
the time domain and then retaining only the next W
columns, was
2
beneficial. The first column represents the average MFCC over the
analysis window, which was empirically found to worsen SID performance compared to selecting alternate DCT coefficients. It was
the development of rankDCT, and plots such as that of Figure 3, that
highlighted the lack of information in the second half of the 2D-DCT
matrix. Taking the first half of the time-domain coefficients is analogous to the use of the Nyquist frequency cutoff for frequency domain
analysis.
Fig. 3. The data-driven manifold of ranked 2D-DCT coefficient indices (higher values are more relevant) from which the top N are
selected as the rankDCT feature.
the feature to generalize well to unobserved data sources. Instead,
we propose rankDCT and pcaDCT as automated methods for coefficient selection or reduction that are expected to be less dependent
on F and W .
2.2.2. Rank DCT Features
2.2.1. Zig-zag DCT Features
A zig-zag strategy for parsing rectangular matrices was proposed
in [2] to select the coefficients that could maximally reconstruct the
input signal from the 2D-DCT. The feature, termed zzDCT in this
work, is a means of extracting a robust spectrotemporal profile from
speech. The zig-zag parsing strategy for a rectangular window can
be seen in Figure 2. This parsing strategy maintains equal relative
selection of coefficients along each boundary axis, which can be observed in the shading of the figure.
In the zig-zag parsing strategy, the ratio of the number of filter
banks F to the number of frames W in the analysis window will alter the parsing. Increasing F will reduce the emphasis on the time
domain and thus reduce the ability of the corresponding feature to
represent the dynamics of speech2 . On the other hand, increasing
W will reduce the selection of coefficients from higher frequency
bands, which are known to be useful in speaker recognition. One
method of counteracting this dependence on F and W is to introduce a scaling parameter on one of the axes. However, an additional
parameter to tune is undesirable, and may reduce the potential of
1 This is synonymous with taking the DCT of MFCCs with a moving window assuming all cepstral coefficients are selected from the filter bank.
2 The zzDCT in this work has more emphasis on frequency than initially
proposed in [2] due to the sub-selection of the 2D-DCT matrix to W
.
2
In contrast to the theoretical motivation behind zig-zag selection,
rankDCT features use a data-driven methodology to select the 2DDCT coefficient indices. The term ‘rank’ relates to the ranking of
F ×( W2−1 ) coefficient indices according to their average intra-frame
energy rank over a set of development speech frames from which an
arbitrary feature dimension of N can be readily selected.
Ranking coefficient indices requires a set of development speech
audio frames S which can be found via speech activity detection.
The average intra-frame energy rank of a coefficient is given as its
average position (or rank) within the sorted values of each speech
frame in set S. This rank metric can be formulated as:
R(f, w) =
S
1X
count(S i (f, w) > Si )
S i=1
(1)
The raw value, S, of the coefficients reflect the energy associated with the corresponding cosine function. Determining the average intra-frame ranking of these functions attempts to capture the
most consistently energized coefficient indices as represented in the
data. An example set of rank values is illustrated as a manifold in
Figure 3. Applying a threshold on these values will result in selection similar to zzDCT; however, the selection is no longer stringently
dependent on F and W .
2.2.3. Principal Component Analysis DCT Features
The aforementioned techniques attempt to optimize selection of coefficients from the 2D-DCT matrix. PcaDCT avoids this step by
utilizing the information of all F × ( W2−1 ) coefficients of half of
the 2D-DCT matrix. As with rankDCT, the 2D-DCT matrices from
a development set of speech frames are used to define the feature
space. Specifically, they are converted to a vector and used to learn a
PCA space P into which vectorized coefficient matrices can be projected, and an arbitrary feature dimensionality defined. The motivation for pcaDCT is to extract coefficient information from a speechrich space. Learning the space P provides an elegant means of targeting particular acoustic conditions in the feature space. The extent
of this perceived benefit and its contrasting potential to reduce generalization of the feature extraction are beyond the scope of this paper
and will be explored in future studies.
Fig. 4. The effect of varying the time analysis window size (W ) for
MFCC/deltas and the proposed DCT approaches. Feature dimension
is fixed to N = 60 and the number of filterbanks F = 24. Note
that MFCC/deltas performance is plotted with respect to the effective
analysis window size of the double deltas.
3. EXPERIMENTAL PROTOCOL AND SYSTEM
CONFIGURATION
We use the same tuning system and eval system configuration and
datasets as in our previous work [2], in which extensive tuning of
MFCC and zzDCT feature parameters was conducted in both clean
and noisy conditions. In this work, however, we concentrate only on
clean speech. These systems are based on the i-vector/probabilistic
linear discriminant analysis (PLDA) framework [4, 5].
Simplified PRISM: This is a small-scale, gender-independent
system [6] for the purpose of feature parameter tuning. A subset of
6440 samples from the PRISM [3] training set was used train a 400D
i-vector subspace, 200D LDA projection space and full-rank PLDA
space. Half of these samples were used to train a 512-component
UBM. Evaluations were performed on a subset of the non-degraded
audio (SRE’10) lists consisting of 14080 target and 688125 impostor trials from 2483 single-segment models and 3824 test segments.
Performance is reported in terms of equal error rate (EER) and the
minimum decision cost function (DCF) defined in the SRE’08 evaluation protocol [7].
Full SRE’12 System: To evaluate tuned features, genderdependent systems was trained in the same manner as our SRE’12
submission [8]. A subset of 8000 clean speech samples were used to
train a 2048-component UBM for each gender. The 600D i-vector
subspace was trained using 51224 samples, while the 300D LDA
reduction matrix and full-rank PLDA were trained using using an
extended dataset of 62277 samples (26k of which were re-noised).
Evaluation was performed on pooled male and female trials of the
five extended conditions defined by NIST based on performance reported in terms of Cprimary [9].
RankDCT and pcaDCT development data: The data-driven
DCT features use a subset of 1000 utterances from the Simplified
PRISM training data set. This set was sourced from 200 speakers,
each contributing 5 samples. Of these speakers, 24 provided 3 microphone utterances and 2 telephone utterances, while the remaining
speakers provided telephone speech only.
4. RESULTS
The first set of experiments aims to highlight any sensitivities of the
four features to the number of filter banks F and analysis window
size W at a fixed feature dimension of N = 60. The optimal feature
dimensions are then found on the tuning set before comparing all
features on the SRE’12 corpus.
Fig. 5. The effect of varying the number of filter banks for each of
the features. The optimal time analysis window of W = 21 (effective) for MFCC/deltas and zzDCT, and W = 25 for rankDCT and
pcaDCT. Feature dimensionality was fixed to N = 60.
4.1. Sensitivity to feature extraction parameters
The proposed data-driven features (rankDCT and pcaDCT) aim to be
less sensitive to feature extraction parameters than MFCC/deltas and
zzDCT by allowing the data to define what is important in a speechrich space. We evaluate each of these features at N = 60 using the
tuning system (see Section 3). Figure 4 illustrates the results of varying W for each feature. First, we note that MFCC/deltas preferred a
context window of W = 21. This window differs from that found
in [2] due to the optimization criteria which additionally included
noisy speech. Noteworthy is the manner in which the curves for
the DCT approaches converge and stabilize around 21 to 25 frames.
This large context was also preferred for clean speech in [2], and
anything short of 19 frames appears to hinder performance on clean
speech. The remaining experiments maintain the optimal selection
of W = 21 for MFCC/deltas and zzDCT and the larger W = 25 for
the data-driven rankDCT and pcaDCT.
Next, we vary the number of filter banks F from 20 to 40 in steps
of 4 for which the resulting performance fluctuation is illustrated in
Figure 5. SID performance appears to vary steadily along with the
number of filter banks for all features except pcaDCT, which had an
unexpected increase in EER at F = 28. Interestingly, zzDCT and
rankDCT preferred fewer filter banks, while MFCC/deltas preferred
the largest F = 36. The plots indicate that no feature is particularly
insensitive to the change in F ; however, there was less variation due
to changes in F than observed when changing W . The following
experiments maintain the optimized W for each feature and an optimized F of 36, 20, 28 and 32 for MFCC/deltas, zzDCT, rankDCT,
and pcaDCT, respectively.
Fig. 6. The effect of varying feature dimensionality after tuning
(W, F ) to (21, 36) for MFCC/deltas, (21, 20) for zzDCT, (25, 28)
for rankDCT and (25, 32) for pcaDCT.
set; however, the noises of SRE’12 were not observed during tuning,
in which only clean speech was considered. Figure 7 details results
using the tuned MFCC/deltas and DCT features.
From Figure 7, the benefit of the DCT-based features over
MFCC/deltas is clear and consistent across conditions. Significant
improvements in noisy conditions were observed even though features were tuned for clean SID performance. Similarly, the datadriven DCT features (rankDCT and pcaDCT) appear to generalize
to noisy data despite using a feature space defined using clean data.
As with [2] zzDCT provides the majority of gains in telephone conditions while being comparable with MFCC/deltas in microphone
conditions. RankDCT also followed this trend, indicating that datadriven coefficient ‘selection’ did not provide a benefit in this regard. The pcaDCT features consistently offered the best performance across conditions, indicating that maximizing speech variation from the sub-selected 2D-DCT in the final feature space was
more suitable for SID than an attempt to sub-select coefficients.
5. CONCLUSIONS
Fig. 7. Cprimary on extended conditions 1–5 of SRE’12 pooled male
and female trials using MFCC/deltas, and proposed DCT features.
4.2. DCT Coefficient Counts
This section illustrates the sensitivity of SID performance to the final
feature dimensionality. For each of the DCT-based features, increasing the number of extracted coefficients relates to more information
relevant to the reconstruction of the log Mel filter bank outputs from
the 2D-DCT. Thus, an arbitrary selection of coefficients is possible.
In the case of MFCC/deltas, we vary the number of raw coefficients
and append deltas and double deltas. Note that a more fair comparison with MFCC/deltas would result from sub-selection from both
raw coefficients and deltas; however, there is no fundamental ranking process to allow this simple selection, as with the DCT-style features.
Figure 6 illustrates the effect on SID performance when varying
feature dimensionality. Reducing N from 60 to 51 for MFCC/deltas
(17 raw features with deltas and double deltas) resulted in a reduction
in EER. This result aligns with results found in [2] on NIST SRE’12.
Each of the DCT-based features maintained optimal and comparable
performance with N = 60. Noteworthy, however, is the limited variation of the rankDCT and pcaDCT features for N between 50 and
80. The EER minima at N = 60 for zzDCT can be explained by the
fact that both W and F have been optimized around this value; thus,
any variation shifts the bias between frequency and time domains
in the feature space. In further experiments, MFCC/deltas will use
N = 51, while the DCT-based features will use N = 60.
4.3. NIST SRE’12 Evaluation
This section aims to determine whether the tuned feature parameters
generalize to the evaluation of the SRE’12 dataset on a large scale
system as defined in Section 3. The term generalization should be
used lightly here, since the bulk of SRE’12 data exists in the PRISM
In this work, the use of DCT coefficients as features for SID was extended from our previous work on zzDCT. We first improved zzDCT
features by sub-selecting to the first half of the 2D-DCT matrix with
respect to the time domain. Then, we proposed two new data-driven
DCT features: rankDCT and pcaDCT. For rankDCT, a development
data set of speech frames was used to rank coefficient indices by
average intra-frame energy rank before selecting the top N as features. In contrast, pcaDCT used this development data set to define
a speech-rich PCA space into which vectorized 2D-DCT matrices
could be projected and an arbitrary feature dimension selected. Feature parameters (filter bank count, analysis window, and final dimensionality) were tuned for each feature and finally evaluated on NIST
SRE’12. All DCT features were shown to outperform MFCC/deltas;
however, zzDCT and rankDCT were comparable in microphone trial
conditions. The superior pcaDCT features offered a relative improvement of 16-23% (average 20%) across both clean and noisy
conditions for all channels.
Future work will consider the effect of the development data
used to learn the PCA space for pcaDCT features and whether the
features can then generalize to mismatched data. We will evaluate
pcaDCT in the context of different input features such as those developed under the DARPA RATS program [10]. Finally, we will investigate whether the benefit of pcaDCT features over MFCC/deltas
is maintained in the context of the DNN/i-vector framework, which
was recently shown to offer state-of-the-art performance in telephone speech [11].
6. REFERENCES
[1] F. Bimbot, J.F. Bonastre, C. Fredouille, G. Gravier, I. MagrinChagnolleau, S. Meignier, T. Merlin, J. Ortega-Garcı́a,
D. Petrovska-Delacrétaz, and D.A. Reynolds, “A tutorial on
text-independent speaker verification,” EURASIP Journal on
Applied Signal Processing, vol. 2004, pp. 430–451, 2004.
[2] M. McLaren, N. Scheffer, L. Ferrer, and Y. Lei, “Effective use
of DCTs for contextualizing features for speaker recognition,”
in Proc. ICASSP, 2014.
[3] L. Ferrer, H. Bratt, L. Burget, H. Cernocky, O. Glembek,
M. Graciarena, A. Lawson, Y. Lei, P. Matejka, O. Plchot, and
Scheffer N., “Promoting robustness for speaker modeling in
the community: The PRISM evaluation set,” in Proc. NIST
2011 Workshop, 2011.
[4] N. Dehak, P. Kenny, R. Dehak, P. Dumouchel, and P. Ouellet, “Front-end factor analysis for speaker verification,” IEEE
Trans. on Speech and Audio Processing, vol. 19, pp. 788–798,
2011.
[5] S.J.D. Prince and J.H. Elder, “Probabilistic linear discriminant
analysis for inferences about identity,” in Proc. IEEE International Conference on Computer Vision. IEEE, 2007, pp. 1–8.
[6] M. Senoussaoui, P. Kenny, N. Brummer, E. De Villiers, and
P. Dumouchel, “Mixture of PLDA models in i-vector space for
gender independent speaker recognition,” in Proc. Int. Conf.
on Speech Communication and Technology, 2011.
[7] The NIST Year 2008 Speaker Recognition Evaluation Plan,
2008,
http://www.itl.nist.gov/iad/mig/
tests/sre/2008/sre08_evalplan_release4.
pdf.
[8] L. Ferrer, M. McLaren, N. Scheffer, Y. Lei, M. Graciarena,
and V. Mitra, “A noise-robust system for NIST 2012 speaker
recognition evaluation,” in Proc. Interpseech, 2013.
[9] The NIST Year 2012 Speaker Recognition Evaluation
Plan, 2012, http://www.nist.gov/itl/iad/mig/
upload/NIST_SRE12_evalplan-v17-r1.pdf.
[10] V. Mitra, M. McLaren, H. Franco, M. Graciarena, and
N. Scheffer, “Modulation features for noise robust speaker
identification,” in Proc. Interspeech, 2013.
[11] Y. Lei, N. Scheffer, L. Ferrer, and M. McLaren, “A novel
scheme for speaker recognition using a phonetically-aware
deep neural network,” in Proc. ICASSP, 2014.


