Dominic Trevisan () and Elina Birmingham
advertisement

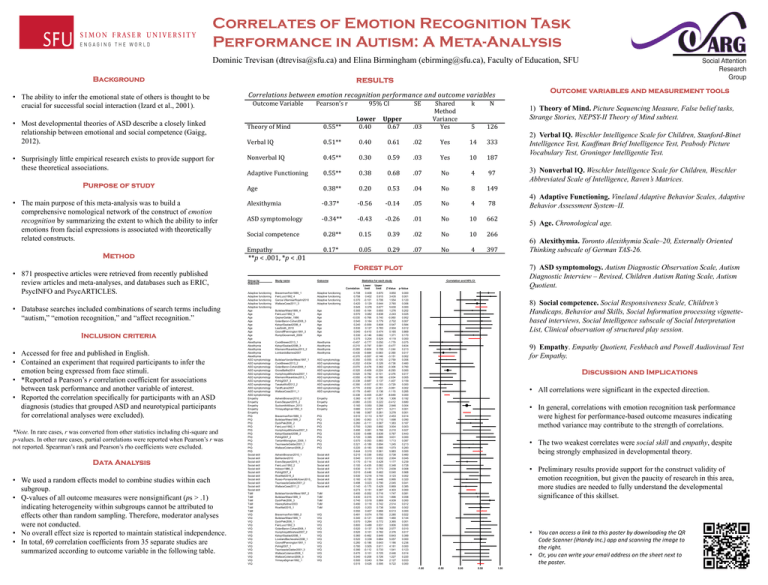
Correlates of Emotion Recognition Task Performance in Autism: A Meta-Analysis Dominic Trevisan (dtrevisa@sfu.ca) and Elina Birmingham (ebirming@sfu.ca), Faculty of Education, SFU Background ! • The ability to infer the emotional state of others is thought to be crucial for successful social interaction (Izard et al., 2001). • Most developmental theories of ASD describe a closely linked relationship between emotional and social competence (Gaigg, 2012). • Surprisingly little empirical research exists to provide support for these theoretical associations. Purpose of study • The main purpose of this meta-analysis was to build a comprehensive nomological network of the construct of emotion recognition by summarizing the extent to which the ability to infer emotions from facial expressions is associated with theoretically related constructs. Method • 871 prospective articles were retrieved from recently published review articles and meta-analyses, and databases such as ERIC, PsycINFO and PsycARTICLES. • Database searches included combinations of search terms including “autism,” “emotion recognition,” and “affect recognition.” Inclusion criteria • Accessed for free and published in English. • Contained an experiment that required participants to infer the emotion being expressed from face stimuli. • *Reported a Pearson’s r correlation coefficient for associations between task performance and another variable of interest. • Reported the correlation specifically for participants with an ASD diagnosis (studies that grouped ASD and neurotypical participants for correlational analyses were excluded). *Note. In rare cases, r was converted from other statistics including chi-square and p-values. In other rare cases, partial correlations were reported when Pearson’s r was not reported. Spearman’s rank and Pearson’s rho coefficients were excluded. Data Analysis • We used a random effects model to combine studies within each subgroup. • Q-values of all outcome measures were nonsignificant (ps > .1) indicating heterogeneity within subgroups cannot be attributed to effects other than random sampling. Therefore, moderator analyses were not conducted. • No overall effect size is reported to maintain statistical independence. • In total, 69 correlation coefficients from 35 separate studies are summarized according to outcome variable in the following table. results Outcome variables and measurement tools Correlations!between!emotion!recognition!performance!and!outcome!variables! Outcome(Variable( Theory(of(Mind( Pearson’s(r( (((((0.55**( 95%(CI( ( Lower&&&&&Upper& (((0.40(((((((((((0.67( SE( .03( Shared( Method( Variance(( Yes( k( ((N( 5( 126( 1) Theory of Mind. Picture Sequencing Measure, False belief tasks, Strange Stories, NEPSY-II Theory of Mind subtest. Verbal(IQ( (((((0.51**( (((0.40(((((((((((0.61( .02( Yes( 14( 333( Nonverbal(IQ((( (((((0.45**( (((0.30(((((((((((0.59( .03( Yes( 10( 187( Adaptive(Functioning( (((((0.55**( (((0.38(((((((((((0.68( .07( No( 4( (97( Age( (((0.20(((((((((((0.53( .04( No( 8( 149( (((((0.38**( 3) Nonverbal IQ. Weschler Intelligence Scale for Children, Weschler Abbreviated Scale of Intelligence, Raven’s Matrices. 4) Adaptive Functioning. Vineland Adaptive Behavior Scales, Adaptive Behavior Assessment System–II. Alexithymia( ((((T0.37*( ((T0.56(((((((((T0.14( .05( No( 4( (78( ASD(symptomology( ((((T0.34**( ((T0.43(((((((((T0.26( .01( No( 10( 662( Social(competence( (((((0.28**( (((0.15(((((((((((0.39( .02( No( 10( 266( Empathy( (((((0.17*( (((0.05(((((((((((0.29( .07( No( 4( 397( Forest Plot **p!<(.001,(*p!<(.01( Study name Outcome Correlation Adaptive functioning Adaptive functioning Adaptive functioning Adaptive functioning Adaptive functioning Age Age Age Age Age Age Age Age Age Alexithymia Alexithymia Alexithymia Alexithymia Alexithymia ASD symptomology ASD symptomology ASD symptomology ASD symptomology ASD symptomology ASD symptomology ASD symptomology ASD symptomology ASD symptomology ASD symptomology ASD symptomology Empathy Empathy Empathy Empathy Empathy PIQ PIQ PIQ PIQ PIQ PIQ PIQ PIQ PIQ PIQ PIQ Social skill Social skill Social skill Social skill Social skill Social skill Social skill Social skill Social skill Social skill Social skill ToM ToM ToM ToM ToM ToM VIQ VIQ VIQ VIQ VIQ VIQ VIQ VIQ VIQ VIQ VIQ VIQ VIQ VIQ VIQ BravermanFein1989_1 FeinLucci1992_4 Garcia-VillamisarRojahn2010 WallaceCase2011_3 Adaptive Adaptive Adaptive Adaptive functioning functioning functioning functioning BuitelaarWees1999_4 FeinLucci1992_5 GepnerGelder_1986 GolanBaron-Cohen2008_3 KatsyriSaalasti2008_4 LawSmith_2010 OzonoffPennington1991_3 RumpGiovannelli_2009 Age Age Age Age Age Age Age Age CookBrewer2013_1 KatsyriSaalasti2008_3 KliemannRosenblau2013_2 LombardoBarnes2007 Alexithymia Alexithymia Alexithymia Alexithymia BuitelaarVanderWees1997_1 CookBrewer2013_2 GolanBaron-Cohen2006_1 GroveBaillie2014 HumphreysMinshew2007_1 KliemannRosenblau2013_1 Pohlig2007_3 TanakaWolf2012_2 TardifLaine2007 WallaceCase2011_1 ASD symptomology ASD symptomology ASD symptomology ASD symptomology ASD symptomology ASD symptomology ASD symptomology ASD symptomology ASD symptomology ASD symptomology AshwinBrosnan2010_2 EversSteyaert2015_2 SucksmithAllison_2013 YirmayaSigman1992_3 Empathy Empathy Empathy Empathy BravermanFein1989_3 BuitelaarWees1999_2 DyckPiek2006_2 FeinLucci1992_1 HumphreysMinshew2007_3 KatsyriSaalasti2008_2 Pohlig2007_2 TantamMonaghan_2006_1 TeunissedeGelder2001_1 WallaceColeman2008_2 PIQ PIQ PIQ PIQ PIQ PIQ PIQ PIQ PIQ PIQ AshwinBrosnan2010_1 BalHarden2010 EversSteyaert2015_1 FeinLucci1992_2 Hobson1986_3 Pohlig2007_4 RiceWall2015_2 Russo-PonsaranMcKown2015_ TeunissedeGelder2001_2 WallaceCase2011_2 Social skill Social skill Social skill Social skill Social skill Social skill Social skill Social skill Social skill Social skill BuitelaarVanderWees1997_2 BuitelaarWees1999_3 DyckPiek2006_3 HeereyKeltner2003 RiceWall2015_1 ToM ToM ToM ToM ToM BravermanFein1989_2 BuitelaarWees1999_1 DyckPiek2006_1 FeinLucci1992_3 GolanBaron-Cohen2008_1 HumphreysMinshew2007_2 KatsyriSaalasti2008_1 LovelandBachevalier2008_1 OzonoffPennington1991_1 Pohlig2007_1 TeunissedeGelder2001_3 WallaceColeman2008_1 WallaceColeman2008_3 YirmayaSigman1992_1 VIQ VIQ VIQ VIQ VIQ VIQ VIQ VIQ VIQ VIQ VIQ VIQ VIQ VIQ Statistics for each study 0.708 0.758 0.370 0.420 0.545 0.300 0.570 -0.030 0.540 0.240 0.530 0.040 0.330 0.375 -0.457 -0.210 -0.265 -0.430 -0.370 -0.350 -0.202 -0.070 -0.320 -0.520 -0.550 -0.338 -0.390 -0.770 -0.179 -0.338 0.360 -0.060 0.160 0.680 0.166 0.510 0.390 0.260 0.700 0.490 0.330 0.720 0.570 0.321 0.220 0.444 0.210 0.540 0.170 0.100 0.530 0.010 0.530 0.160 0.498 0.140 0.273 0.400 0.430 0.740 0.490 0.520 0.550 0.481 0.340 0.570 0.800 0.520 0.520 0.360 0.520 0.280 0.780 0.390 0.470 0.340 0.500 0.515 Lower limit 0.408 0.402 -0.101 0.129 0.378 -0.164 0.082 -0.766 0.164 -0.559 0.127 -0.410 -0.146 0.204 -0.777 -0.797 -0.604 -0.684 -0.557 -0.555 -0.634 -0.478 -0.409 -0.782 -0.780 -0.687 -0.557 -0.932 -0.461 -0.405 -0.187 -0.333 0.050 0.312 0.067 0.113 -0.063 -0.111 0.293 0.061 -0.488 0.395 -0.093 -0.189 -0.183 0.310 -0.339 0.013 -0.114 -0.435 0.151 -0.446 0.216 -0.155 0.023 -0.175 0.151 -0.052 -0.015 0.518 0.118 0.203 0.407 0.074 -0.121 0.264 0.488 0.137 0.101 -0.462 0.339 -0.186 0.505 -0.112 0.101 -0.209 0.043 0.426 Upper limit 0.870 0.915 0.706 0.644 0.677 0.655 0.838 0.740 0.779 0.808 0.783 0.474 0.682 0.524 0.050 0.581 0.155 -0.083 -0.146 -0.105 0.326 0.362 -0.224 -0.101 -0.188 0.137 -0.193 -0.351 0.136 -0.267 0.736 0.222 0.266 0.871 0.261 0.767 0.710 0.567 0.892 0.766 0.839 0.885 0.883 0.694 0.560 0.561 0.652 0.832 0.428 0.582 0.773 0.462 0.745 0.446 0.790 0.429 0.387 0.716 0.733 0.869 0.742 0.738 0.666 0.750 0.680 0.772 0.931 0.768 0.782 0.849 0.664 0.643 0.911 0.733 0.725 0.726 0.784 0.595 Correlation and 95% CI Z-Value p-Value 3.850 3.435 1.554 2.760 5.630 1.276 2.243 -0.060 2.702 0.547 2.504 0.165 1.371 4.119 -1.779 -0.477 -1.244 -2.390 -3.151 -2.759 -0.738 -0.306 -6.293 -2.376 -2.834 -1.407 -3.729 -3.061 -1.115 -8.849 1.306 -0.412 2.846 3.211 3.278 2.453 1.698 1.383 3.004 2.210 0.767 3.631 1.713 1.245 1.073 5.983 0.738 2.004 1.177 0.348 2.639 0.040 3.123 0.995 2.045 0.869 4.303 1.747 1.896 4.939 2.514 3.050 6.513 2.285 1.460 3.365 3.806 2.577 2.376 0.843 5.057 1.186 4.181 1.541 2.446 1.227 2.127 9.722 0.000 0.001 0.120 0.006 0.000 0.202 0.025 0.952 0.007 0.584 0.012 0.869 0.170 0.000 0.075 0.634 0.213 0.017 0.002 0.006 0.460 0.760 0.000 0.017 0.005 0.159 0.000 0.002 0.265 0.000 0.192 0.680 0.004 0.001 0.001 0.014 0.090 0.167 0.003 0.027 0.443 0.000 0.087 0.213 0.283 0.000 0.460 0.045 0.239 0.728 0.008 0.968 0.002 0.320 0.041 0.385 0.000 0.081 0.058 0.000 0.012 0.002 0.000 0.022 0.144 0.001 0.000 0.010 0.017 0.399 0.000 0.236 0.000 0.123 0.014 0.220 0.033 0.000 5) Age. Chronological age. 6) Alexithymia. Toronto Alexithymia Scale–20, Externally Oriented Thinking subscale of German TAS-26. 7) ASD symptomology. Autism Diagnostic Observation Scale, Autism Diagnostic Interview – Revised, Children Autism Rating Scale, Autism Quotient. Forest plot Group by Outcome 2) Verbal IQ. Weschler Intelligence Scale for Children, Stanford-Binet Intelligence Test, Kauffman Brief Intelligence Test, Peabody Picture Vocabulary Test, Groninger Intelligentie Test. 8) Social competence. Social Responsiveness Scale, Children’s Handicaps, Behavior and Skills, Social Information processing vignettebased interviews, Social Intelligence subscale of Social Interpretation List, Clinical observation of structured play session. 9) Empathy. Empathy Quotient, Feshbach and Powell Audiovisual Test for Empathy. Discussion and Implications • All correlations were significant in the expected direction. • In general, correlations with emotion recognition task performance were highest for performance-based outcome measures indicating method variance may contribute to the strength of correlations. • The two weakest correlates were social skill and empathy, despite being strongly emphasized in developmental theory. • Preliminary results provide support for the construct validity of emotion recognition, but given the paucity of research in this area, more studies are needed to fully understand the developmental significance of this skillset. • You can access a link to this poster by downloading the QR Code Scanner (iHandy Inc.) app and scanning the image to the right. • Or, you can write your email address on the sheet next to the poster. -1.00 -0.50 Favours A 0.00 0.50 Favours B 1.00

