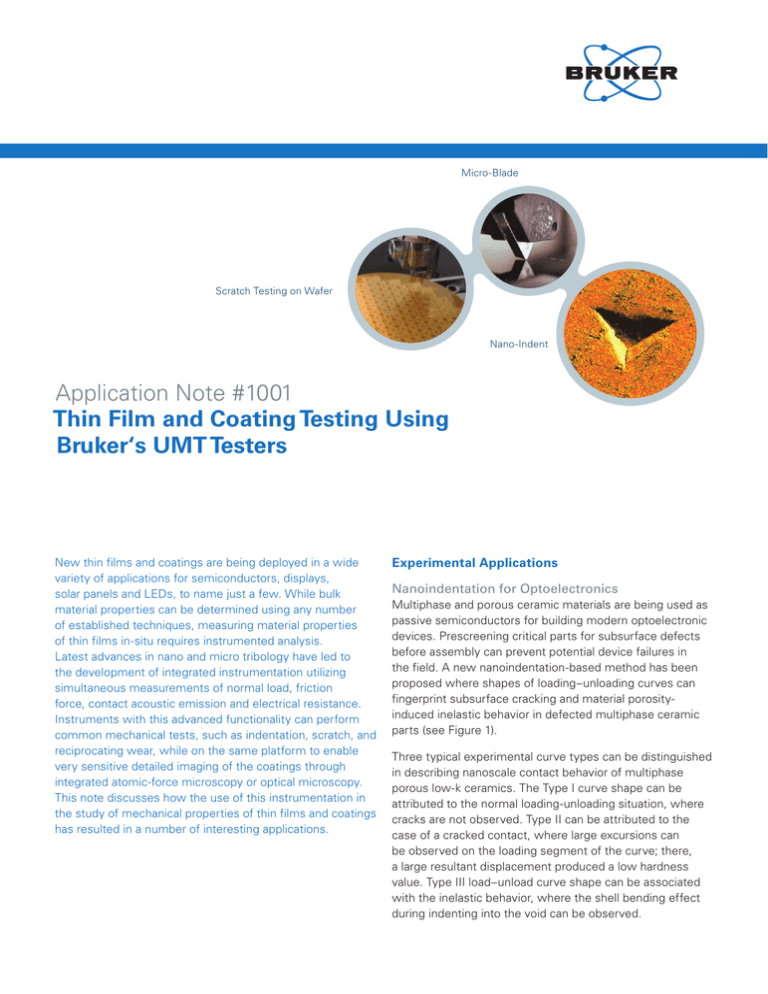
Micro-Blade
Scratch Testing on Wafer
Nano-Indent
Application Note #1001
Thin Film and Coating Testing Using
Bruker‘s UMT Testers
New thin films and coatings are being deployed in a wide
variety of applications for semiconductors, displays,
solar panels and LEDs, to name just a few. While bulk
material properties can be determined using any number
of established techniques, measuring material properties
of thin films in-situ requires instrumented analysis.
Latest advances in nano and micro tribology have led to
the development of integrated instrumentation utilizing
simultaneous measurements of normal load, friction
force, contact acoustic emission and electrical resistance.
Instruments with this advanced functionality can perform
common mechanical tests, such as indentation, scratch, and
reciprocating wear, while on the same platform to enable
very sensitive detailed imaging of the coatings through
integrated atomic-force microscopy or optical microscopy.
This note discusses how the use of this instrumentation in
the study of mechanical properties of thin films and coatings
has resulted in a number of interesting applications.
Experimental Applications
Nanoindentation for Optoelectronics
Multiphase and porous ceramic materials are being used as
passive semiconductors for building modern optoelectronic
devices. Prescreening critical parts for subsurface defects
before assembly can prevent potential device failures in
the field. A new nanoindentation-based method has been
proposed where shapes of loading–unloading curves can
fingerprint subsurface cracking and material porosityinduced inelastic behavior in defected multiphase ceramic
parts (see Figure 1).
Three typical experimental curve types can be distinguished
in describing nanoscale contact behavior of multiphase
porous low-k ceramics. The Type I curve shape can be
attributed to the normal loading-unloading situation, where
cracks are not observed. Type II can be attributed to the
case of a cracked contact, where large excursions can
be observed on the loading segment of the curve; there,
a large resultant displacement produced a low hardness
value. Type III load–unload curve shape can be associated
with the inelastic behavior, where the shell bending effect
during indenting into the void can be observed.
A
B
C
Figure 1. Shape of loading-unloading curves: Type I (a) for normal nanoindentation, Type II (b) corresponding to the crack, and Type III (c)
corresponding to the inelastic response and can be attributed to the air bubble beneath the surface.
Measured elastic modulus (Er), nanohardness (H) and
Knoop hardness (HK) values were obtained for every
sample, at three locations (#1, #2, #3). Experimental data
suggest that the observed scattering of H and HK is a
result of the non-homogeneity of the low-K material, due
to the presence of multiple phases. It is observed that in
the cracked or void-filled areas nanohardness is two to four
times lower than values measured at other locations. A
very consistent result trend, obtained from the destructive
microhardness Knoop tests, verified the findings. Contact
stiffness and resulting Er had large errors due to the
non-homogeneity of samples as well as rough surfaces.
Nanoindentation instrument errors were negligible for the
applied 30–70mN loads.
Scratch-Hardness Test of Hard Coatings
Micro-scratch-hardness tests were performed on two
specimens using a diamond stylus with a tip radius of 5μm.
The test was conducted with reference to ASTM G171-03
(Standard Test Method for Scratch Hardness of Materials
Using a Diamond Stylus), modified for thin coatings. The
scratch hardness of a material can be determined by
producing a scratch on the sample surface with a sharp,
hard (diamond) tool with known tip geometry, under a
constant, load. Measuring the scratch width, one can define
the sample scratch hardness as:
HSp = k*Fz / W2
where HSp is the scratch hardness number, k is a constant,
Fz is applied load, and W is scratch width.
When the constant k is unknown, the scratch hardness can
be determined by comparison of the scratch width on the
sample and on a reference material with known hardness
value:
HSsample = (HSref * Wref 2 / Fz ref)* Fz sample / Wsample2
where the indices “sample” and “ref” refer to the test
sample and reference material, respectively.
The diamond stylus in a stylus holder was mounted on the
force sensor with a spring suspension. The test sample
was mounted on a table of the lower linear drive, allowing
for automated lateral motion and thereby multiple scratches
on a single specimen. An acoustic emission sensor was
attached to the stylus holder to monitor the high-frequency
signal generated during scratching, which indicates the
intensity of material fracture.
To begin the test, a normal load of 0.4N was applied to the
stylus. The scratch was produced by dragging the stylus
along the sample surface with the upper lateral slider.
The scratch length was 5mm, and dragging speed was
0.5mm/s. Load was maintained constant throughout the
test by controlling the z-carriage motion based on closedloop feedback from the force gauge.
Figure 2. Friction coefficient (gray) and AE (black) signals during micro-scratch tests on samples 1 and 4.
2
A
B
Figure 3. 3D AFM images of scratches on sample 1 (a) and sample 2 (b) at a scan size of 25μm x 25μm.
The test was repeated three times on each sample to verify
the data consistency and repeatability. A polished fused
quartz (with the hardness of 9.5GPa) was used as the
reference material for the scratch-hardness calculations.
COF and AE data as a function of time are plotted in
Figure 2.
Following the test, the scratch width was measured by an
atomic force microscope (AFM) head, and AFM images of
the scratches were taken. Table 1 shows the mean values
of the coefficient of friction (COF) and acoustic emission
(AE) for both specimens, along with the scratch width W
and scratch hardness. Figure 3 shows 3D AFM images
of the scratches on both samples. Screenshots with the
scratch width measurements are shown in Figure 4.
Table 1. Micro-scratch test data with diamond stylus.
Sample #
Mean COF
Mean AE
W, µm
HS, GPa
1
0.49
0.04
5.87
23.40
4
0.27
0.67
5.00
32.20
Scratch-Adhesion on LCD Display Samples
Conceptually similar to scratch-hardness, scratch adhesion
with a micro-indenter or a micro-blade is performed by
sliding under a linearly increasing load (Fz). The failure of the
coating is characterized by sudden change in coefficient of
friction (COF) or contact acoustic emission (AE). Adhesion
strength of the coating or thin film is characterized by
the corresponding load at which COF and AE exhibit a
sudden change.
Figure 5 shows data from scratch-adhesion tests using a
diamond stylus with a 12.5μm tip radius, at a sliding speed
of 0.5mm/s over a distance of 10mm on a patterned LCD
display with a coating layer sequence of indium-tin-oxide/
overcoat/matrix on a glass substrate. At the point of failure
at load of about 16mN, both COF and AE increased. The
periodic bumps in the COF and Fz plot were due to the
rapid interaction of the diamond tip with the patterned top
surface of the specimen.
During the test, the indenter moved slowly on the coating,
causing some material removal (Figure 6). A series of runs
with progressively increasing normal loads, though constant
within each run, was performed. The normal load started
from 1N in the first run and was increased by 0.5N each
run until coating failure was observed. The critical load
characterizing the coating scratch resistance was defined as
the minimum load to cut through the coating completely.
The results for three different LCD samples, each tested
three times (see Table 2), show repeatable differences
between coatings. The typical scratch raw data are
presented in Figure 7 and Figure 8, illustrating various
stages in the process of cutting through the coatings with
the load increase.
Table 2. Scratch Test Results
Critical Load (N)
Sample ID
1st Test
2nd Test
3rd Test
1
5.0
5.5
5.5
2
4.0
4.0
4.0
3
2.5
3.0
2.5
3
In wear testing, the indenter was stationary, while the
sample stage was reciprocating, which caused coating
wear. Having determined the critical load required for
coating failure in the scratch test above, a constant load
of 1N was chosen for the wear test. The goal was to
determine a load that would stress the material but not
break through immediately. Following application of the
load, the sample was cycled in a reciprocating motion until
the coating was worn through. Coating wear resistance was
defined as the minimum number of cycles to wear through
the coating completely. The results for three different LCD
samples, each tested three times and summarized in Table
3, show repeatable differences between the coatings.
These results correlate with the scratch data in that the
samples showing highest resistance to break through also
show highest resistance to wear.
Tribological Properties of DLC Films
It is well known that the wear-resistance of monolithic
materials can be greatly increased by the introduction of
diamond-like carbon (DLC) thin films. Recently, DLC thin
films have been used successfully in components such
as rigid discs and microelectronic-mechanical systems
(MEMS), whose protective coatings are required to have
excellent wear-resistance in light load and high velocity
working conditions. Tests were conducted to measure
the variation of the frictional coefficients over time for an
Al2O3 ball against a Si substrate (Figure 10a.). The test was
repeated with a similar setup but, in this second case, the Si
substrate was coated with a DLC film, approx. 250nm thick
(Figure 10b.). The bare Si substrate sliding against the Al2O3
ball shows a frictional coefficient as high as 0.40–0.60.
During the test wear, debris was visible to the naked eye
after just a few sliding cycles, which indicated that the Si
substrate has poor wear resistance. In contrast, the DLC
film shows a much lower steady-state frictional coefficient
Table 3. Wear Test Results
Critical # Cycles, Thousands
Sample ID
1st Test
2nd Test
3rd Test
1
2.7
2.5
2.6
2
2.1
2.2
2.0
3
1.1
1.2
1.1
of 0.13, and this remains almost unchanged even after two
hours under the same test conditions.
Clearly the addition of a DLC film to the Si substrate
greatly improves the wear resistance, and these tests
provide invaluable data in evaluating the benefit of such
friction-modifying coatings and in determining the relative
performance improvements one could expect to see
between different coating types. The coated material far
outperforms the monolithic Si material, which makes it
possible to use the DLC film as a promising protective
coating to Si- and SiC-based components in MEMS.6
Mechanical and Tribological Properties of Carbon
Nanotube (CNT) Composite Coatings
A steel ball is placed on top of the coated specimen with a
normal load of 0.5–4 N. The coated specimen reciprocates
underneath the ball at 3.0–5.0Hz. All the friction and wear
tests were performed under unlubricated condition at room
temperature and in ambient air
A
Figure 4. Example of scratch width measurement for sample 1 (a) and sample 4 (b).
4
B
Figure 5. Fz, COF, and AE plots for scratch adhesion tests on LCD specimen.
(relative humidity 52%–56%). The friction coefficient was
recorded continuously during the tests.
Figure 12 shows the typical load-unload curves for the
Ni-Co and Ni-Co-CNTs composite coating subject to the
nanoindentation measurement at a depth of 200nm. Based
on the load-unload curves, the Ni-Co-CNTs composite
coating had a nanoindentation hardness of 5.87GPa and
an elastic modulus of 236GPa. The values for the Ni-Co
alloy coating were 4.41GPa and 202GPa. This implies that
the Ni-Co-CNTs composite coatings could have better
tribological properties than the Ni-Co alloy coatings.7
Using the same basic test configuration, the friction
coefficients for the Ni-Co coating and Ni-Co-CNTs
composite coating were measured through multiple sliding
cycles and the results are displayed in Figure 13. It is clear
that the Ni-Co-CNTs composite coating has much lower
friction coefficient than the Ni-Co alloy coating under the
same test conditions, and the friction coefficient of each
coating gradually increases over time under test.7
Another interesting observation is that the friction
coefficient of the Ni-Co-CNTs composite coating decreases
with increasing normal load under these test conditions.
This could be attributed to the formation of a lubricious
transfer layer on the counterpart surface during sliding.
Subsequently, the friction is reduced owing to the formation
of the lubricious transfer layer.7
The unique modular design permits the user to quickly
reconfigure the instrument to any one of a number of test
modes by simply swapping the easily-replaceable drive
stages and sensors. A high-frequency multichannel dataacquisition system, with data sampling at thousands times
per second, allows for detection of almost instantaneous
tiny submicro-contact and submicro-failure events in
sophisticated test sequences. Integrated optical microscopy
is available for precision sample micro-positioning, digital
video of the in-situ dynamics of surface failure and microimages of wear tracks, indents and scratches. Optional
integrated atomic force microscope and profilometry provide
higher resolution imaging and quantification of test surfaces,
wear tracks, indents and scratches, both periodically during
testing and post-test.
Interchangeable Modules
Bruker tribo-testers have two easily-interchangeable
modules (see Figure 14) that can accommodate either a
nano-head or micro-head transducer-sensor assembly.
Both heads can be used to measure hardness, Young’s
modulus, yield stress, fracture toughness, and contact
Capabilities of Bruker Tribo-Testers
Based on the examples above, which are just a few of
the known applications within the area of thin films and
coatings testing, quite a number of tests can be carried
out on Bruker’s tribo-testers. This apparatus is a highprecision instrument for nano and micro mechanical testing
of practically all types of thin films and coatings, including
metals, ceramics, composites, polymers, etc.
Figure 6. Schematic of scratch/wear test setups.
6
A
A
B
B
C
C
Figure 7. Sample 1: (a) at 2N the coating was not cut, (b) at 3.5N
the coating started to break, (c) at 4N the coating broke, but did
not totally cut through.
Figure 8. Sample 4: (a) at 1N the coating was not broken, (b) at
2N the coating started to break, (c) at 3N the coating broke, but
did not totally cut through.
stiffness or critical loads for onset of inelastic deformation
during scratch and indentation tests. The nano-head is used
primarily for thin films coatings and multi-phase materials,
while the micro-head is used for bulk materials and
relatively-thick films.
A
Both modules are equipped with an optical microscope and
can also have an in-line imaging attachment, either AFM in
the case of the nano-head or 3D profiler on the micro-head.
The AFM measuring head contains a three-dimensional
(3D) scanner with a probe holder and a laser-optic system
for probe deflection detection, as well as an integrated
digital optical microscope. Its scanning range is from
110x110x20µm. The 3D profiler measuring head contains a
white light interferometer (WLI) x-y scanner with a stylus
holder and a full-time color CCD camera. The 3D profiler’s
scanning range is from 10x10x10µm to 500x500x500µm.
Methodology for Scratch/Indentation Test
The following test procedure can be done on the Bruker
tribo-testers for a comprehensive evaluation of the sample
coatings/thin films properties:
B
Nano/Micro-indentation tests for coating nano/microhardness and elastic modulus evaluation,
Scratch-hardness tests under constant load for scratch
resistance and hardness measurement,
Scratch-adhesion tests under progressively increasing
load for evaluation of the coating adhesion and scratch
toughness properties,
Slow reciprocating wear tests for evaluation of coating
friction and durability.
C
Figure 9. Sample 3: (a) at 1.5N the coating started to break, (b)
at 2N coating broke, but did not totally cut through, (c) at 3N the
coating was totally cut through.
7
A
B
Figure 10. Variation of the friction coefficients with sliding time for (a) Si substrate against an Al2O3 ball and (b) DLC film about 250nm thick
against the Al2O3 ball.
Figure 11. Contact configuration of the friction pair.
A
Figure 12. Typical load-displacement curves of(a) Ni-Co-CNTs
composite coatings.
B
Figure 13. Friction coefficient of (a) Ni-Co and (b) Ni-Co-CNTs composite coatings/GCr15 steel ball as a function of sliding cycles.
8
A
B
Figure 14. Nano-Module (a) and Micro-Module (b) for tribo-testers.
Table 4. List of ASTM scratch/indentation test standards.
ASTM #
Description
C1624-10
Adhesion Strength and Mechanical Failure Modes of Ceramic Coatings
D1474-98
Indentation Hardness of Organic Coatings
D1894-06
Static and Kinetic Coefficients of Friction of Plastic Film and Sheeting
D2240-00
Shore Hardness of Soft Materials
D4518-91
Static Friction of Coating Surfaces
D7027-05
Scratch Reistance of Polymeric Coatings and Plastics
D7187-05
Mechanistic Aspects of Scratch/Mar Behavior of Paint Coatings
E92-82 & E384-99
Vickers and Knoop Hardness Tests Using a Diamond Indenter
G171-03
Scratch Hardness of Materials Using a Diamond Stylus
9
References
1. N. Gitis, J. Xiao, A. Daugela, and A.K. Sikder. “Quantitative
Nano & Micro Scale Metrology of Thin Films and Coatings” 4th
International Conference on Industrial Tribology, (2004) 1-5.
5. M. Vinogradov, J. Xiao, and N. Gitis. “Scratch, Adhesion and Wear
Testing of LCD Display Coatings,” The Adhesion Society, (2004)
444-446.
2. A. Daugela, N. Gitis, and V. Gelfeinbein. “Phenomenological
Nanoindentation Technique in Quality Control of Optoelectronics
Devices,” Springer-Verlag, (2008).
6. X.B. Yan, T. Xu, S.R. Yang, H.W. Liu, and Q.J. Xue.
“Characterization of Hydrogentated Diamond-Like Carbon Films
Electrochemically Deposited on a Silicon Substrate,” Journal of
Physics D: Applied Physics, 37 (2004) 2416-2424.
3. N. Gitis, I. Hermann, and S. Kuiry. “Nano and Micro Indentation
and Scratch Tests of Mechanical Properties of Thin Films,” 7th
International Conference THE Coatings, (2008) 371-378.
4. N. Gitis, S. Kuiry, A. Daugela, M. Vinogradov, and J. Xiao.
“Comprehensive Tribo-Mechanical Testing of Hard Coatings,”
Society of Vacuum Coaters, 505 (2006) 599-605.
7. L. Shi, C.F. Sun, P. Gao, F. Zhou, and W.M. Liu. “Electrodeposition.
and Characterization of Ni-Co-Carbon Nanotubes Composite
Coatings,” Elsevier, 10.1016/j.surfcoat (2005).
Author
James Earle, Bruker Nano Surfaces Division
(james.earle@bruker-nano.com)
Bruker Nano Surfaces Divison
Campbell, CA · USA
+1.408.376.4040/866.262.4040
productinfo@bruker-nano.com
www.bruker.com
10
specifications without notice. ©2012 Bruker Corporation. All rights reserved. AN1001, Rev. A0
Bruker Nano Surfaces Division is continually improving its products and reserves the right to change
Dr. Suresh Kuiry, Bruker Nano Surfaces Division
(suresh.kuiry@bruker-nano.com)

