Windows on Housing
advertisement

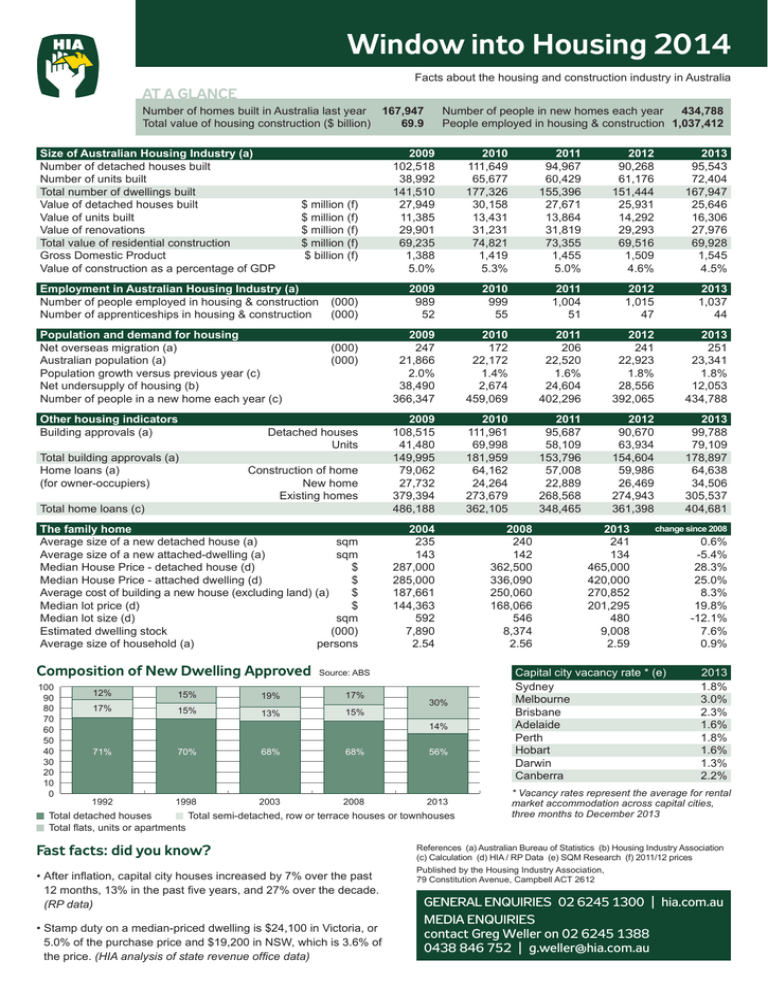
Window into Housing 2014 Facts about the housing and construction industry in Australia AT A GLANCE Number of homes built in Australia last year 167,947 Total value of housing construction ($ billion) 69.9 Size of Australian Housing Industry (a) Number of detached houses built Number of units built Total number of dwellings built Value of detached houses built Value of units built Value of renovations Total value of residential construction Gross Domestic Product Value of construction as a percentage of GDP Number of people in new homes each year 434,788 People employed in housing & construction 1,037,412 2009 102,518 38,992 141,510 27,949 11,385 29,901 69,235 1,388 5.0% 2010 111,649 65,677 177,326 30,158 13,431 31,231 74,821 1,419 5.3% 2011 94,967 60,429 155,396 27,671 13,864 31,819 73,355 1,455 5.0% 2012 90,268 61,176 151,444 25,931 14,292 29,293 69,516 1,509 4.6% 2013 95,543 72,404 167,947 25,646 16,306 27,976 69,928 1,545 4.5% 2009 989 52 2010 999 55 2011 1,004 51 2012 1,015 47 2013 1,037 44 2009 247 21,866 2.0% 38,490 366,347 2010 172 22,172 1.4% 2,674 459,069 2011 206 22,520 1.6% 24,604 402,296 2012 241 22,923 1.8% 28,556 392,065 2013 251 23,341 1.8% 12,053 434,788 Other housing indicators Building approvals (a) Detached houses Units Total building approvals (a) Home loans (a) Construction of home (for owner-occupiers) New home Existing homes Total home loans (c) 2009 108,515 41,480 149,995 79,062 27,732 379,394 486,188 2010 111,961 69,998 181,959 64,162 24,264 273,679 362,105 2011 95,687 58,109 153,796 57,008 22,889 268,568 348,465 2012 90,670 63,934 154,604 59,986 26,469 274,943 361,398 2013 99,788 79,109 178,897 64,638 34,506 305,537 404,681 The family home Average size of a new detached house (a) sqm Average size of a new attached-dwelling (a) sqm Median House Price - detached house (d) $ Median House Price - attached dwelling (d) $ Average cost of building a new house (excluding land) (a) $ Median lot price (d) $ Median lot size (d) sqm Estimated dwelling stock (000) Average size of household (a) persons 2004 235 143 287,000 285,000 187,661 144,363 592 7,890 2.54 $ million (f) $ million (f) $ million (f) $ million (f) $ billion (f) Employment in Australian Housing Industry (a) Number of people employed in housing & construction (000) Number of apprenticeships in housing & construction (000) Population and demand for housing Net overseas migration (a) Australian population (a) Population growth versus previous year (c) Net undersupply of housing (b) Number of people in a new home each year (c) (000) (000) Composition of New Dwelling Approved Source: ABS 100 90 80 70 60 50 40 30 20 10 0 12% 15% 19% 17% 17% 15% 13% 15% 30% 14% 71% 70% 68% 68% 56% 1992 1998 2003 2008 2013 Total detached houses Total semi-detached, row or terrace houses or townhouses Total flats, units or apartments Fast facts: did you know? •After inflation, capital city houses increased by 7% over the past of New Dwellings Approved 12 months, 13% in the past five years, and 27% over the decade. (RP data) •Stamp duty on a median-priced dwelling is $24,100 in Victoria, or 5.0% of the purchase price and $19,200 in NSW, which is 3.6% of the price. (HIA analysis of state revenue office data) 2008 240 142 362,500 336,090 250,060 168,066 546 8,374 2.56 2013 241 134 465,000 420,000 270,852 201,295 480 9,008 2.59 change since 2008 Capital city vacancy rate * (e) Sydney Melbourne Brisbane Adelaide Perth Hobart Darwin Canberra 0.6% -5.4% 28.3% 25.0% 8.3% 19.8% -12.1% 7.6% 0.9% 2013 1.8% 3.0% 2.3% 1.6% 1.8% 1.6% 1.3% 2.2% * Vacancy rates represent the average for rental market accommodation across capital cities, three months to December 2013 References (a) Australian Bureau of Statistics (b) Housing Industry Association (c) Calculation (d) HIA / RP Data (e) SQM Research (f) 2011/12 prices Published by the Housing Industry Association, 79 Constitution Avenue, Campbell ACT 2612 GENERAL ENQUIRIES 02 6245 1300 | hia.com.au MEDIA ENQUIRIES contact Greg Weller on 02 6245 1388 0438 846 752 | g.weller@hia.com.au


