International trade substantially higher again
advertisement

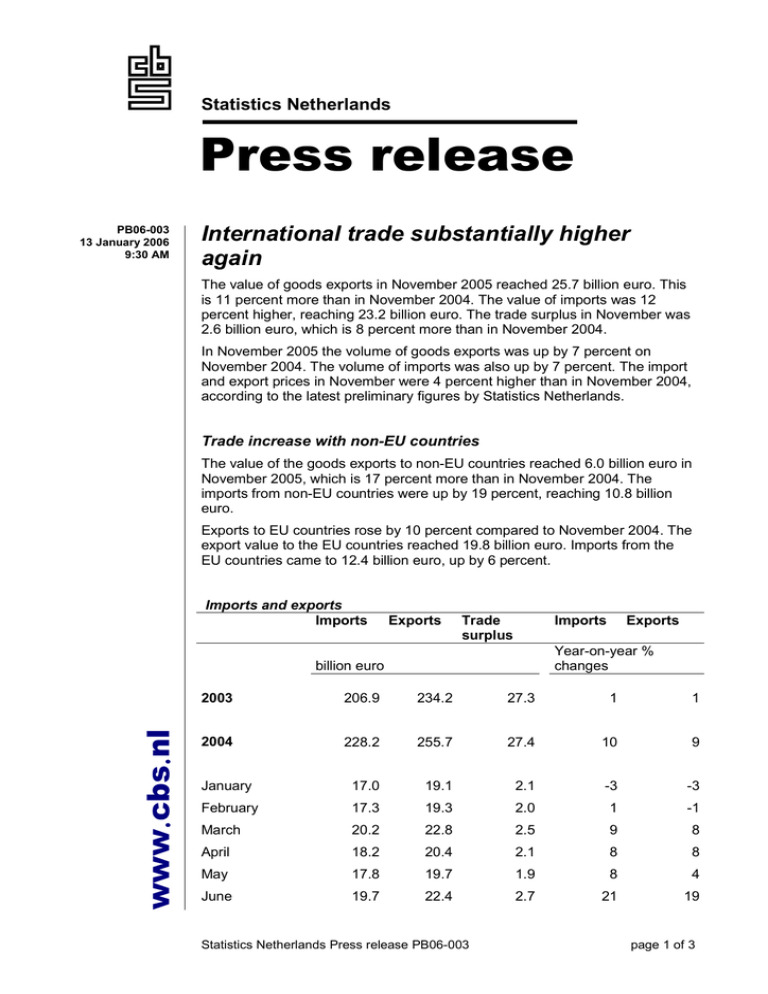
Statistics Netherlands Press release PB06-003 13 January 2006 9:30 AM International trade substantially higher again The value of goods exports in November 2005 reached 25.7 billion euro. This is 11 percent more than in November 2004. The value of imports was 12 percent higher, reaching 23.2 billion euro. The trade surplus in November was 2.6 billion euro, which is 8 percent more than in November 2004. In November 2005 the volume of goods exports was up by 7 percent on November 2004. The volume of imports was also up by 7 percent. The import and export prices in November were 4 percent higher than in November 2004, according to the latest preliminary figures by Statistics Netherlands. Trade increase with non-EU countries The value of the goods exports to non-EU countries reached 6.0 billion euro in November 2005, which is 17 percent more than in November 2004. The imports from non-EU countries were up by 19 percent, reaching 10.8 billion euro. Exports to EU countries rose by 10 percent compared to November 2004. The export value to the EU countries reached 19.8 billion euro. Imports from the EU countries came to 12.4 billion euro, up by 6 percent. Imports and exports Imports Exports Trade surplus Imports Year-on-year % changes billion euro www.cbs.nl Exports 2003 206.9 234.2 27.3 1 1 2004 228.2 255.7 27.4 10 9 January 17.0 19.1 2.1 -3 -3 February 17.3 19.3 2.0 1 -1 March 20.2 22.8 2.5 9 8 April 18.2 20.4 2.1 8 8 May 17.8 19.7 1.9 8 4 June 19.7 22.4 2.7 21 19 Statistics Netherlands Press release PB06-003 page 1 of 3 July 18.4 20.8 2.4 11 12 August 18.2 19.6 1.4 20 17 September 19.9 23.2 3.3 13 12 October 20.2 22.8 2.6 7 6 November 20.7 23.1 2.4 18 16 December 20.6 22.4 1.9 13 14 January 18.7 21.3 2.6 10 11 February 18.7 21.4 2.7 8 11 March 20.9 24.2 3.3 3 6 April 20.2 23.1 2.9 11 13 May 19.3 22.3 3.0 8 13 June 20.7 23.8 3.0 5 6 July 20.1 22.1 2.0 9 6 August 20.3 22.2 1.9 11 13 September 22.0 25.1 3.1 10 8 22.0# 24.4# 2.4# 9# 7# 23.2 25.7 2.6 12 11 2005* October November * preliminary figures # adjusted figures. Source: CBS Statistics Netherlands Press release PB06-003 page 2 of 3 Volume changes adjusted for changes in prices and working days Imports Imports Exports Year-on-year % volume change, adjusted for working days Exports Year-on-year % price changes 2003 -3 -2 4 2 2004 1 0 9 8 January 1 2 10 10 February 3 3 6 8 March 3 3 3 5 April 2 3 8 9 May 2 2 4 8 June 3 2 3 4 July 4 3 9 6 Augustus 4 3 4 6 September 3 3 7 5 October 3 3 6# 4# November 4 4 7 7 2005* *) preliminary figures Source: CBS Statistics Netherlands Press release PB06-003 page 3 of 3

