Case study
Interim leadership and process optimization
helps improve ED performance
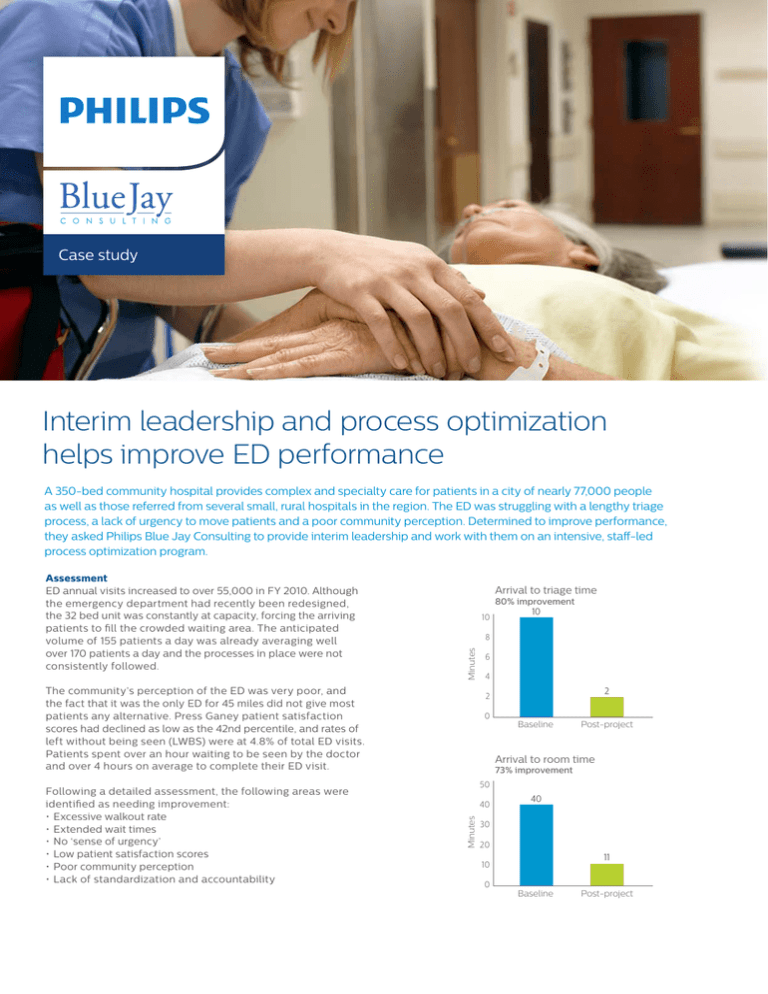
A 350-bed community hospital provides complex and specialty care for patients in a city of nearly 77,000 people
as well as those referred from several small, rural hospitals in the region. The ED was struggling with a lengthy triage
process, a lack of urgency to move patients and a poor community perception. Determined to improve performance,
they asked Philips Blue Jay Consulting to provide interim leadership and work with them on an intensive, staff-led
process optimization program.
Arrival
Arrival to
to triage
triage time
time
80% improvement
80% improvement
10
10
The community’s perception of the ED was very poor, and
the fact that it was the only ED for 45 miles did not give most
patients any alternative. Press Ganey patient satisfaction
scores had declined as low as the 42nd percentile, and rates of
left without being seen (LWBS) were at 4.8% of total ED visits.
Patients spent over an hour waiting to be seen by the doctor
and over 4 hours on average to complete their ED visit.
6
6
4
4
22
2
2
0
0
Baseline
Baseline
Post-project
Post-project
Arrival
Arrival to
to room
room time
time
50
50
40
40
Minutes
Minutes
Following a detailed assessment, the following areas were
identified as needing improvement:
• Excessive walkout rate
• Extended wait times
• No ‘sense of urgency’
• Low patient satisfaction scores
• Poor community perception
•Lack of standardization and accountability
10
10
8
8
Minutes
Minutes
Assessment
ED annual visits increased to over 55,000 in FY 2010. Although
the emergency department had recently been redesigned,
the 32 bed unit was constantly at capacity, forcing the arriving
patients to fill the crowded waiting area. The anticipated
volume of 155 patients a day was already averaging well
over 170 patients a day and the processes in place were not
consistently followed.
73% improvement
73% improvement
40
40
30
30
20
20
11
11
10
10
0
0
Baseline
Baseline
Post-project
Post-project
Left
Left without
without being
being seen
seen
(LWBS)
(LWBS) rate
rate
5%
5%
4%
4%
79% improvement
79% improvement
4
4 .. 8
8
Arrival to triage time
80% improvement
10
10
Minutes
8
6
4
2
Percent
Minutes
Minutes
Minutes
2
Process
Results
Philips Blue Jay Consulting was brought in to facilitate the
At the end of 6 months:
0
changes and manage the department. The two
consultants
Post-project• Arrival to triage times were reduced from 10 to 2 minutes,
Baseline
worked side by side with the caregivers for six months. The first
an 80% improvement
action implemented was to gather feedback from the caregivers,
• Arrival to room times were reduced from 40 to 11 minutes,
asking
themtototriage
identify
providing
quality,
a 73% improvement
Arrival
to room
time
Arrival
timespecific barriers to
efficient
to patients.
• The left without being seen rates declined from 4.8% to >1%,
73% improvement
80%care
improvement
10
a 79% improvement
50
10
The staff identified 250+ barriers, focused on key 40
areas, and
• Press Ganey scores improved dramatically from 4th percentile
8
formed
six workgroups to address these40issues. The primary
to 82nd percentile
focus remained the patient arrival experience
and patient flow
30
6
through the department. Additional workgroups concentrated
Impact
20
on the
physical appearance of the department,
leadership
The reduction in patients leaving the waiting room without
4
development, staffing/scheduling
and improving care for the 11
being seen equated to over 1,000 ED patients representing a
2
10
2
mental health population.
$2.8 million increase in revenue for the facility. The enhanced
triage processes represented improved time to the doctor, thus
0
0
Post-projectdecreasing risk to patients. The enhanced processes decreased
Baseline
Post-project
Baseline
Implementation
The project was called “Show You!” taken from Missouri’s showwasted steps and time, improving caregiver and patient
Left without
beingto:
seen
me attitude. As part of this project, ED caregivers
committed
satisfaction.
(LWBS) rate
Arrival
to room
time
• Show
we care
about
our patients
79% improvement
73%
improvement
• Show
compassion
5% times4 . 8
50
• Show
the community we will improve wait
Learn more
40
4%
40
Through collaborative and patient-focused engagements,
The triage team’s focus was to improve the “front end”. This
Philips Healthcare Transformation Services can help
3%
30
included
full ESI triage education, a customer
service focus for
you unlock insights and opportunities to solve your
arriving patients as well as renaming and redesigning the “lobby”.
2%
most complex challenges of care delivery. We can help
20
The throughput team concentrated on realigning the zones of
you achieve meaningful and sustainable improvements
11
.
0
1
care,
1% patients and staffing to
10 addressing the arrival patterns of the
in clinical excellence, operational efficiency, care
meet the demands.
delivery, and financial performance to improve value
0
0
Baseline
Post-project to your patients. For more information, please visit
Post-project
Baseline
www.philips.com/healthcareconsulting.
Left without being seen
Customer satisfaction
(LWBS) rate
Significant improvement
79% improvement
5%
4.8
100%
Percent
Percent
3%
2%
1.0
1%
0
82
80%
4%
Baseline
Post-project
60%
40%
20%
0
4
Baseline
Post-project
Customer satisfaction
improvement
© 2016Significant
Koninklijke
Philips N.V. All rights reserved.
100%
Specifications
are subject to change without notice
Percent
80%
www.philips.com
4522 991 18391 * MAR 2016
60%
82
40%
20%
0
4
Baseline
Post-project
Results from case studies are not predictive of results
in other cases. Results in other cases may vary.


