How to Make Animated GIFs
advertisement
How to Make Animated GIFs
The EPDC has developed a variety of different animated charts in Excel, but these charts have their
limitations. They require macros, which some people are not able to run, and they can’t be used online. To get
around this, we can create animated GIFs which can be used on a web page. This involves three steps:
1. Save a series of image files to be combined into one animation
2. Use Macromedia Fireworks to combine these images into an animated GIF
3. Create an HTML page that includes the GIF, a couple of buttons, and some simple Javascript that
controls the image
Saving a series of image files
It would be helpful if you familiarize yourself with the tutorial on making animated graphs, because saving an
image file for each year is a minor addition to the macro. The Excel file that accompanies this tutorial uses
human capital pyramids rather than scatter charts, but the theory behind creating an animated chart is the
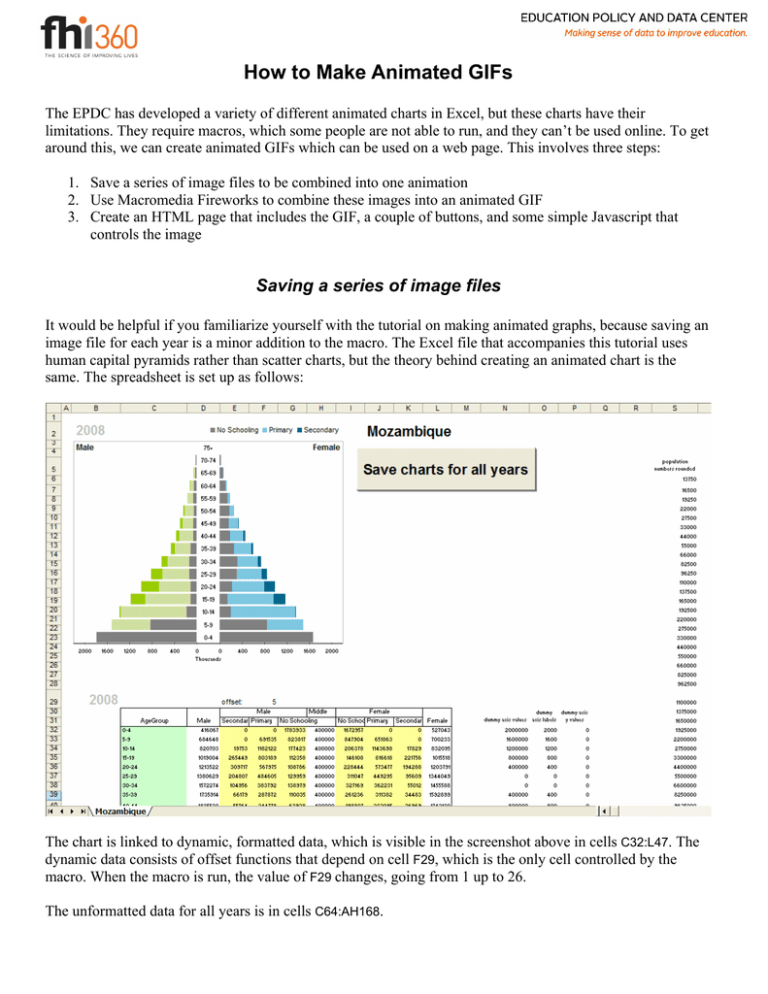
same. The spreadsheet is set up as follows:
The chart is linked to dynamic, formatted data, which is visible in the screenshot above in cells C32:L47. The
dynamic data consists of offset functions that depend on cell F29, which is the only cell controlled by the
macro. When the macro is run, the value of F29 changes, going from 1 up to 26.
The unformatted data for all years is in cells C64:AH168.
If you were making animated GIFs for multiple countries, you would import the data into these cells, but in
this tutorial we’re only going to use one country.
The macro is fairly simple. When the button is clicked, it calls CommandButton4_Click(). This function
loops through all of the years, and for each year, it calls a second function: SaveChart. SaveChart takes three
arguments. The first argument is the chart, which is identified by its chart number. The second argument is the
path to the folder in which you want to save the images. And the final argument is the name that you want to
give to the file.
Const DIR_LOCATION = "C:\Documents and Settings\soliver\Desktop\Charts\animHCP"
Private Sub CommandButton4_Click()
Dim i As Integer
i = 1
Do While i <= 26 'there are 26 years to loop through (2003 to 2028)
Sheet3.Cells.Range("F29").Value = i - 1 'sets the value of the offset cell
'calls the function "SaveChart"
SaveChart Sheet3.ChartObjects("Chart 284").Chart, DIR_LOCATION,
Sheet3.Cells.Range("J2").Value & CStr(i)
i = i + 1
Loop
End Sub
Private Sub SaveChart(CurChart As Chart, Path As String, FileName As String)
Dim fs As New FileSystemObject
'if the directory doesn't exist, creates a new folder
If Not fs.FolderExists(Path) Then
fs.CreateFolder Path
End If
Set fs = Nothing
DoEvents
CurChart.Export FileName:=Path & "\" & FileName & ".png", FilterName:="PNG"
End Sub
Notice that the macro refers to Chart 284. You can determine the chart number as follows: click on any cell
in the workbook. Hold down the shift key, and click on the chart. Release the mouse button and shift key, and
move your mouse. The chart number will appear in the name field:
The file directory is defined in the first line of the macro. You’ll need to change this to point to a file on your
computer before running the macro. The name that we give to the image file is up to you, but in this case,
we’re naming it after the country (cell J2 contains the text, “Mozambique”) and we’re using the value of i, so
we’ll have a bunch of files named Mozambique1.png, Mozambique2.png, etc.
When saving charts as images, it’s important to have the worksheet at 100% magnification. If it isn’t, Excel
will mess up the chart formatting. If you haven’t already, change the file path in the first line of the macro,
and click the button on the spreadsheet to create the charts.
Using Fireworks to create an animated GIF
For this next step, you’ll need to install Macromedia Fireworks on your computer. The software is in a black
box labeled “Studio MX 2004.”
Open Fireworks and go to File Open… In the dialog that appears, navigate to the folder with your charts,
and select them all. Check the “open as animation” option.
Click “Open.” Fireworks will open all of the charts as frames in a single document. Go to Window Frames
if Frames is not already checked. There should now be a panel to the right of the pyramid chart, like the one
below:
If you click on the different frames, the pyramid changes from one year to the next. As you look at the
different frames, you’ll notice that they are not quite in the right order. I don’t know exactly why. You’ll need
to drag the frames around until they’re in the right order, with the earliest year as Frame 1, and the final year
as Frame 26.
The “7” next to each frame indicates that the frame will be visible for 7/100 of a second.
A short digression into how animated GIFs work: You can create GIFs that run through a sequence of frames
once and then stop, or you can have them loop endlessly. Usually when we create an animated graph, we want
it to run once and then stop. Unfortunately, animated GIFs stop on the first frame of the animation rather than
the last frame, so the pyramid would proceed from 2003 to 2028, jump back to 2003 immediately, and then
stop. We can deal with this by setting the GIF to loop continuously, but have the duration of the final frame be
very long (relative to the duration of the other frames. So we’re going to change the duration of Frame 26 to
be 9999/100 of a second, which is the maximum allowed by Fireworks. Double-click on the “7” next to
Frame 26, and change the duration:
You should also change the duration of the rest of the frames, because 7/100 of a second is too short. Try
30/100 and adjust from there. You can change all of the frames at once (except Frame 26), by shift-clicking to
select them all, and then double-clicking on one of the 7s.
Now go to File Export Wizard…
Click “Continue.”
Click “Continue” again. In the next window, you don’t need to change any settings, just click “Export…”
Choose a location in which to save your file and give it a name (I’d suggest Mozambique.gif), and then go
and open it to see if it worked. If you just double-click on the file, it will probably open in Microsoft Photo
Editor or some other program where the animation will not work properly. You’ll need to open it in a browser
in order to see the animation in action.
Congratulations—you’ve created an animated GIF. However, it’s still a little deficient. The animation starts
running as soon as you open the page, and to re-start the animation, you have to reload. It would be nice to at
least provide the illusion of control.
Creating an HTML page to contain the GIF
Open a Notepad document, go to File Save As… , change the document type to “All files” and save the file
as Mozambique.html in the same folder that contains your animated GIF and all of the individual image files.
If you save it in a different folder, you’ll need to change the code below so that it’s looking for the image files
wherever they are.
This is not a tutorial on how to create web pages, so I’m just going to give you the code to copy, with a short
explanation of how it works. Copy the following text into Mozambique.html:
<html>
<head>
<title>Mozambique</title>
</head>
<body>
<h1>Mozambique</h1>
<img id="ImageLocation" src="Mozambique1.png" width=552 height=489>
<form>
<input type="button" id="startButton" value='start'
onClick="PlayButtonClick()">
<input type="button" id="resetButton" value='reset'
onClick="ResetButtonClick()">
</form>
<script type="text/javascript">
//when the "Play" button is clicked, the source of the image is
changed to Mozambique.gif (the animated GIF)
function PlayButtonClick() {
document.getElementById('ImageLocation').src='Mozambique.gif';
}
//when the "Reset" button is clicked, the source of the image is
changed to Mozambique1.png (the static pyramid from 2003)
function ResetButtonClick() {
document.getElementById('ImageLocation').src='Mozambique1.png';
}
</script>
</body>
</html>
An HTML document is just a series of nested elements. So within the HTML element (<html>) there is the
<head> element, which contains the page title. The </head> tag marks the end of the <head> section. Within
the <body> element, there is header text that says “Mozambique,” an image, and a form which contains two
buttons. After the form element ends (</form>), there is a script section. When you view the page in a
browser, the script section will not be visible—it’s the equivalent to a macro in an Excel document. In this
case, the script section just contains two simple functions that are executed when the buttons in the form are
clicked.
When the page is first loaded, the image that is shown is the static PNG for 2003. When the Start button is
clicked, the image switches to the animated GIF, and as soon as the GIF is loaded, it runs from start to finish.
Clicking on the Reset button changes the image back to the static PNG.
Save your changes to Mozambique.html and close it. If you double-click on Mozambique.html now, it should
by default open in a web browser.
If you are creating animated charts for a client, you would need to give them Mozambique.html,
Mozambique.gif, and Mozambique1.png, and let them know that all of the files need to be placed in the same
directory.
