Scatter Plot & Line of Best Fit Guide
advertisement

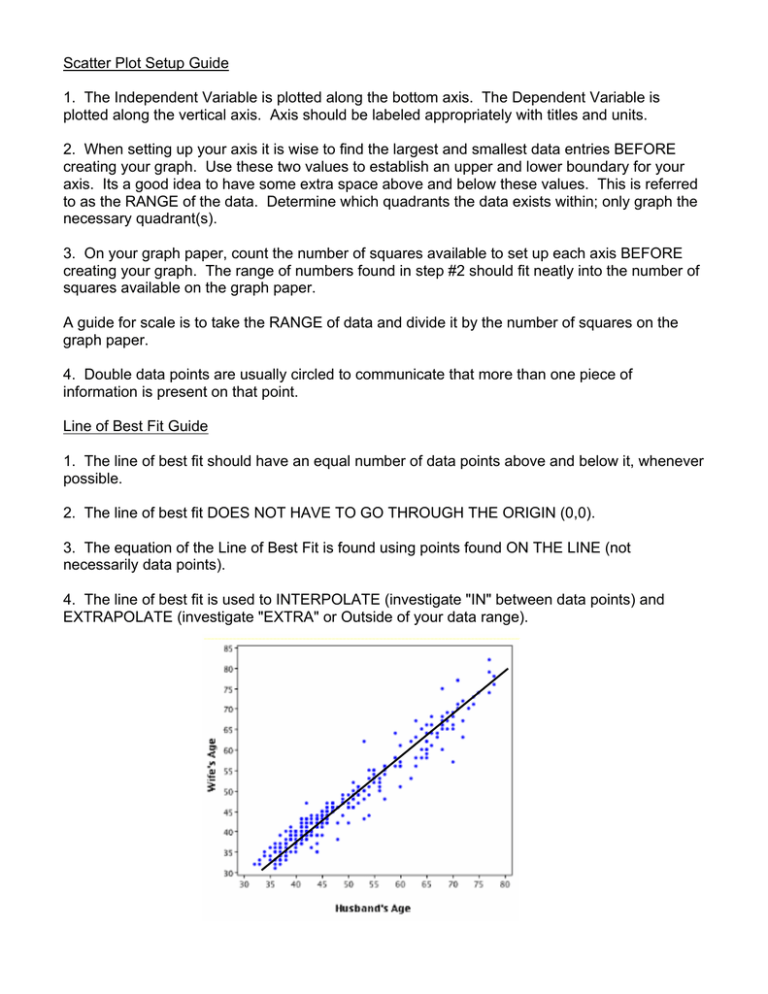
Scatter Plot Setup Guide 1. The Independent Variable is plotted along the bottom axis. The Dependent Variable is plotted along the vertical axis. Axis should be labeled appropriately with titles and units. 2. When setting up your axis it is wise to find the largest and smallest data entries BEFORE creating your graph. Use these two values to establish an upper and lower boundary for your axis. Its a good idea to have some extra space above and below these values. This is referred to as the RANGE of the data. Determine which quadrants the data exists within; only graph the necessary quadrant(s). 3. On your graph paper, count the number of squares available to set up each axis BEFORE creating your graph. The range of numbers found in step #2 should fit neatly into the number of squares available on the graph paper. A guide for scale is to take the RANGE of data and divide it by the number of squares on the graph paper. 4. Double data points are usually circled to communicate that more than one piece of information is present on that point. Line of Best Fit Guide 1. The line of best fit should have an equal number of data points above and below it, whenever possible. 2. The line of best fit DOES NOT HAVE TO GO THROUGH THE ORIGIN (0,0). 3. The equation of the Line of Best Fit is found using points found ON THE LINE (not necessarily data points). 4. The line of best fit is used to INTERPOLATE (investigate "IN" between data points) and EXTRAPOLATE (investigate "EXTRA" or Outside of your data range).


