Television Audience 2008
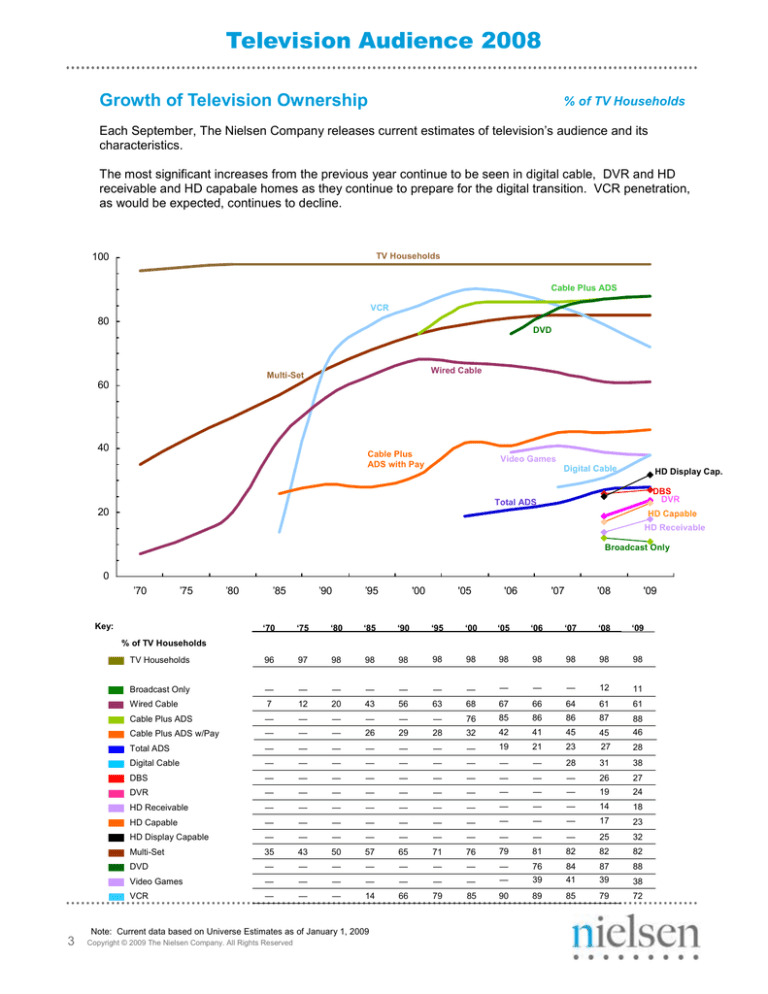
Growth of Television Ownership
% of TV Households
Each September, The Nielsen Company releases current estimates of television’s audience and its
characteristics.
The most significant increases from the previous year continue to be seen in digital cable, DVR and HD
receivable and HD capabale homes as they continue to prepare for the digital transition. VCR penetration,
as would be expected, continues to decline.
TV Households
100
Cable Plus ADS
VCR
80
DVD
Wired Cable
Multi-Set
60
40
Cable Plus
ADS with Pay
Video Games
Digital Cable
HD Display Cap.
DBS
DVR
Total ADS
20
HD Capable
HD Receivable
Broadcast Only
0
’70
’75
Key:
’80
’85
’90
’95
'00
'05
'06
'07
'08
'09
‘70
‘75
‘80
‘85
‘90
‘95
‘00
‘05
‘06
‘07
‘08
‘09
TV Households
96
97
98
98
98
98
98
98
98
98
98
98
Broadcast Only
—
—
—
—
—
—
—
—
—
—
12
11
Wired Cable
7
12
20
43
56
63
68
67
66
64
61
61
Cable Plus ADS
—
—
—
—
—
—
76
85
86
86
87
88
Cable Plus ADS w/Pay
—
—
—
26
29
28
32
42
41
45
45
46
Total ADS
—
—
—
—
—
—
—
19
21
23
27
28
Digital Cable
—
—
—
—
—
—
—
—
—
28
31
38
DBS
—
—
—
—
—
—
—
—
—
—
26
27
DVR
—
—
—
—
—
—
—
—
—
—
19
24
HD Receivable
—
—
—
—
—
—
—
—
—
—
14
18
HD Capable
—
—
—
—
—
—
—
—
—
—
17
23
HD Display Capable
—
—
—
—
—
—
—
—
—
—
25
32
Multi-Set
35
43
50
57
65
71
76
79
81
82
82
82
DVD
—
—
—
—
—
—
—
—
—
—
—
—
—
—
76
39
84
41
87
39
88
Video Games
—
—
VCR
—
—
—
14
66
79
85
90
89
85
79
72
% of TV Households
3
Note: Current data based on Universe Estimates as of January 1, 2009
Copyright © 2009 The Nielsen Company. All Rights Reserved
38
Television Audience 2008
Trends in Television Ownership
TV Households in Millions
Excludes Alaska and Hawaii
92.1
100.8
95.4
110.2
111.4
112.8
114.5
109.6
'05
'06
'07
'08
'09
84.9
76.3
69.6
60.1
’70
’75
’80
Sept.
’85
’90
’95
'00
Jan.
‘70
‘75
‘80
‘85
‘90
‘95
‘00
‘05
‘06
‘07
‘08
Wired Cable
3.9
8.6
15.2
36.3
51.9
60.5
68.6
73.9
73.2
71.4
69.3
70.2
Cable Plus ADS
—
—
—
—
—
—
—
—
94.8
96.2
98.5
100.9
Cable Plus ADS w/Pay
—
—
—
21.8
27.1
27.1
31.8
46.3
45.6
49.7
51.2
52.9
Total ADS
—
—
—
—
—
—
—
20.8
22.7
25.8
30.2
31.7
Digital Cable
—
—
—
—
—
—
—
—
—
30.8
35.5
43.0
DBS
—
—
—
—
—
—
—
—
22.1
25.1
29.5
31.2
DVR
—
—
—
—
—
—
—
—
—
—
21.0
28.0
20.8
30.0
38.3
48.2
60.1
67.6
76.2
86.6
89.5
91.9
93.0
94.0
DVD
—
—
—
—
—
—
—
—
84.0
93.3
98.0
101.2
Video Games
—
—
—
—
—
—
—
—
43.0
46.0
44.4
43.2
VCR
—
—
—
11.5
60.7
75.8
85.8
98.9
97.7
95.2
88.8
82.6
Multi-Set
Television Set Ownership
‘09
% of TV Households
Number of Sets per Household
1 Set
57
49
43
35
41
36
2 Sets
3 or More Sets
Average Number of
Sets Per
Household
4
29
36
35
11
21
19
18
18
18
35
33
31
31
30
28
50
51
52
54
'09
38
32
15
24
19
41
46
24
'75
’80
’85
’90
’95
'00
'05
'06
'07
'08
1.57
1.6
1.83
2.00
2.28
2.43
2.62
2.73
2.79
2.83
Note: Current data based on Universe Estimates as of January 1, 2009
Copyright © 2009 The Nielsen Company. All Rights Reserved
2.86
Television Audience 2008
Station Growth
Stations on the Air
For comparison purposes to historical data reported, the following station growth data is based on October
2008 data. As the country continues to prepare for the digital transition, we continue to see a decrease
across the VHF and UHF stations. Digital stations continue to increase, as to be expected.
VHF
UHF
Digital
1992
346
1902
1750
224
1857
1851
1837
224
225
223
1769
335
224
1713
325
1633
1626
1646
1614
1531
1526
1545
1567
294
1388
1203
1237
248
Total
Public
Commercial
Independent
Network
Affiliates
12
912
917
927
122
918
122
911
121
122
791
795
805
796
789
205
229
216
205
202
862
911
789
744
740
153
211
134
362
431
586
566
589
591
587
664
634
844
882
874
802
1026
1254
1205
1225
'04
'05
'06
'07
'08
'04
'05
'06
'07
'08
'04
'05
'06
'07
'08
955
122
Note: Current data based on October 2008
Copyright © 2009 The Nielsen Company. All Rights Reserved
Television Audience 2008
Stations and Channels Receivable
Per TV Household
Distribution of TV Households
The average TV household in the U.S. receives 17.7 broadcast TV stations. 42% of all homes can receive
up to 14 stations, and 37% receive 20 or more stations. Homes that receive 30 or more stations have risen
to 9%.
Growing digital cable and satellite penetration increased the tuning options in the average household. In
2008, the average home received 130.1 channels, an increase of almost twelve channels. The percentage
of homes receiving 100+ channels rose from 58% in 2007 to 64% in 2008.
1990
2000
2005
2006
2007
2008
Broadcast Stations
11.7
13.5
16.3
17.5
17.0
17.7
All Channels
33.2
61.4
96.4
104.2
118.6
130.1
Number of Stations (%)
6
16
30+
15-19
4
26
7
7
29
28
11
9
42
47
58
64
28
100+
60-99
50-59
40-49
30-39
20-29
15-19
0-14
47
24
20-29
0-14
1
12
Number of Channels (%)
56
78%
22
22
21
21
63%
37
33
48%
42%
44%
7
42%
11
7
30%
21
6
3
7
13
2000
2005
2006
2007
2008
1990
11.7
13.5
16.3
17.5
17.0
17.7
33.2
2
1
2
2
1
3
5%
2000
2005
2006
2007
2008
61.4
96.4
104.2
118.6
130.1
Note: Current data based on households installed the week of 09/01/08—09/07/08. Tuning is Live+7
and based on at least 10+ contiguous minutes during this week.
Copyright © 2009 The Nielsen Company. All Rights Reserved
2
1
5
3
5%
9%
1990
1
7
4
5%
6
Average Number
Per Household
26
7
1
1
1 1
4
2
5%
Television Audience 2008
Broadcast Stations Receivable vs. Tuned
# of Stations
The vast majority, 93% of sample homes, receive between 1 and 30 broadcast stations, while 66% of these
homes receive 1 to 20 broadcast stations. More than 5% of the sample homes receive more than 30 stations. Homes receiving 1 to 10 stations tune to 41% of their available options. The average household receives 17.7 broadcast stations.
Receivable Stations
1-10
11-20
21-30
31-40
41-50
51-60
61-70
71-80
81-90
Total US
Share of Sample %
20.8
45.2
26.5
5.6
0.9
0.3
0.1
LT
LT
100
82.0
75.7
64.9
55.3
43.8
34.1
24.8
17.7
15.1
8.1
Average
Receivable
Average Tuned
3.3
4.3
5.0
5.4
6.0
7.2
5.5
9.9
6.1
4.4
% Tuned
41
29
20
16
14
13
8
13
7
25
14
Note: Current data based on households installed the week of 09/01/08—09/07/08. Tuning is Live+7
and based on at least 10+ contiguous minutes during this week.
Copyright © 2009 The Nielsen Company. All Rights Reserved
Television Audience 2008
Channels Receivable vs. Tuned
# of Channels
As the number of channels available to a household increases, so does the number of channels tuned. In
2008, the average household tuned to almost 18 channels or 14% of the 130.1 channels available. Homes
receiving over 40 channels tuned between 12.5 and 21 channels on average. In homes with 121 or more
channels, where an average of 178.3 are available, 21 of those channels (12%) are actually tuned.
Share of Sample %
1-10
11-20
21-30
31-40
41-50
51-60
61-70
71-80
81-90
3.0
4.9
3.9
1.1
0.8
1.5
8.3
8.3
2.1
91-100 101-110 111-120
2.3
2.1
2.2
121+
59.5
Total US
100
17 8 . 3
13 0 . 1
115 . 8
10 5 . 4
95 . 8
84 . 8
74 . 4
66 . 6
56 . 4
45 . 0
35 . 0
25 . 3
15 . 4
Average
Receivable
6 .6
Average Tuned
3.8
5.9
7.5
9.9
12.5
16.5
15.9
16.4
16.8
16.4
17.1
17.5
21.0
17.8
% Tuned
58
39
30
28
28
29
24
22
20
17
16
15
12
14
15
Note: Current data based on households installed the week of 09/01/08—09/07/08. Tuning is Live+7
and based on at least 10+ contiguous minutes during this week.
Copyright © 2009 The Nielsen Company. All Rights Reserved


