task: false positives
advertisement
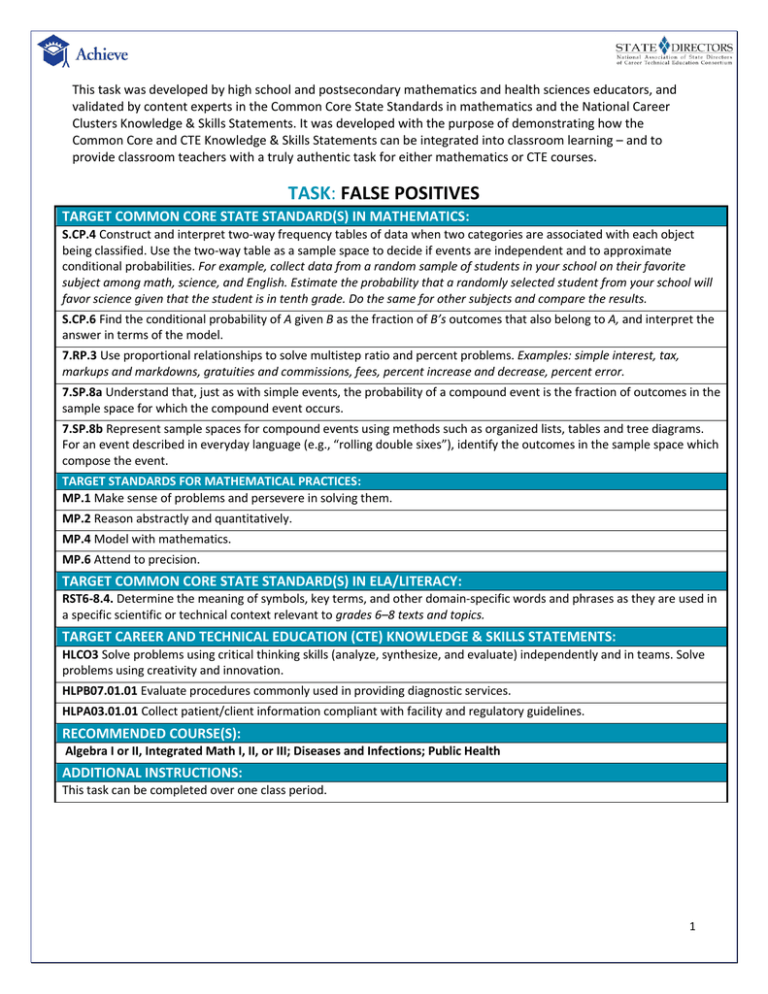
This task was developed by high school and postsecondary mathematics and health sciences educators, and validated by content experts in the Common Core State Standards in mathematics and the National Career Clusters Knowledge & Skills Statements. It was developed with the purpose of demonstrating how the Common Core and CTE Knowledge & Skills Statements can be integrated into classroom learning – and to provide classroom teachers with a truly authentic task for either mathematics or CTE courses. TASK: FALSE POSITIVES TARGET COMMON CORE STATE STANDARD(S) IN MATHEMATICS: S.CP.4 Construct and interpret two-way frequency tables of data when two categories are associated with each object being classified. Use the two-way table as a sample space to decide if events are independent and to approximate conditional probabilities. For example, collect data from a random sample of students in your school on their favorite subject among math, science, and English. Estimate the probability that a randomly selected student from your school will favor science given that the student is in tenth grade. Do the same for other subjects and compare the results. S.CP.6 Find the conditional probability of A given B as the fraction of B’s outcomes that also belong to A, and interpret the answer in terms of the model. 7.RP.3 Use proportional relationships to solve multistep ratio and percent problems. Examples: simple interest, tax, markups and markdowns, gratuities and commissions, fees, percent increase and decrease, percent error. 7.SP.8a Understand that, just as with simple events, the probability of a compound event is the fraction of outcomes in the sample space for which the compound event occurs. 7.SP.8b Represent sample spaces for compound events using methods such as organized lists, tables and tree diagrams. For an event described in everyday language (e.g., “rolling double sixes”), identify the outcomes in the sample space which compose the event. TARGET STANDARDS FOR MATHEMATICAL PRACTICES: MP.1 Make sense of problems and persevere in solving them. MP.2 Reason abstractly and quantitatively. MP.4 Model with mathematics. MP.6 Attend to precision. TARGET COMMON CORE STATE STANDARD(S) IN ELA/LITERACY: RST6-8.4. Determine the meaning of symbols, key terms, and other domain-specific words and phrases as they are used in a specific scientific or technical context relevant to grades 6–8 texts and topics. TARGET CAREER AND TECHNICAL EDUCATION (CTE) KNOWLEDGE & SKILLS STATEMENTS: HLCO3 Solve problems using critical thinking skills (analyze, synthesize, and evaluate) independently and in teams. Solve problems using creativity and innovation. HLPB07.01.01 Evaluate procedures commonly used in providing diagnostic services. HLPA03.01.01 Collect patient/client information compliant with facility and regulatory guidelines. RECOMMENDED COURSE(S): Algebra I or II, Integrated Math I, II, or III; Diseases and Infections; Public Health ADDITIONAL INSTRUCTIONS: This task can be completed over one class period. 1 About the Common Core State Standards in Mathematics The Common Core State Standards (CCSS) for Mathematics are organized by grade level in grades K–8. At the high school level, the standards are organized by conceptual category (number and quantity, algebra, functions, geometry, and probability and statistics), showing the body of knowledge students should learn in each category to be college and career ready, and to be prepared to study more advanced mathematics. The Standards for Mathematical Practice describe ways in which developing student practitioners of the discipline of mathematics increasingly ought to engage with the subject matter as they grow in mathematical maturity and expertise throughout the elementary, middle and high school years. www.corestandards.org About the Common Core State Standards in English Language Arts/Literacy The Common Core State Standards (CCSS) for ELA/Literacy are organized by grade level in grades K–8. At the high school level, the standards are organized by 9-10 and 11-12 grade bands. Across K-12 there are four major strands: Reading, Writing, Speaking and Listening, and Language. The CCSS also include Standards for Literacy in History/Social Studies, Science, and Technical Subjects, with content-specific (Reading and Writing) literacy standards provided for grades 6-8, 9-10, and 11-12, to demonstrate that literacy needs to be taught and nurtured across all subjects. www.corestandards.org About the Career Cluster Knowledge and Skill Statements As an organizing tool for curriculum design and instruction, Career Clusters™ provide the essential knowledge and skills for the 16 Career Clusters™ and their Career Pathways. It also functions as a useful guide in developing programs of study bridging secondary and postsecondary curriculum and for creating individual student plans of study for a complete range of career options. As such, it helps students discover their interests and their passions, and empowers them to choose the educational pathway that can lead to success in high school, college and career. http://www.careertech.org/career-clusters/resources/clusters/health.html. Although not included in this template, all Clusters and Pathways have Foundational Academic Expectations and Essential Knowledge & Skills Statements, which, in some cases, overlap with the Common Core State Standards. KEY TERMS False positive False negative Screening Two-way table 2 FALSE POSITIVES1 – The Task A diagnostic cancer test can have false positive and false negative results. A false positive result occurs when a person without the disease tests positive. Likewise, a false negative occurs when a person with the disease gets a negative result. A town of 48,730 residents is implementing a new cancer screening for all residents. One half of one percent (0.5%) of people in the town actually have the disease. The test has a 92% accuracy rate for positive results, with an 8% false positive rate for detecting cancer. 1. How many people in the town have cancer? How many do not? Explain your answers. 2. Of the people that do have cancer, how many will test positive in the screening? Explain your answer. 3. Of those that do not have cancer, how many will test positive in the screening? Explain your answer. 4. Create a two-way table to display all possible outcomes. Use your table to answer the questions that follow. 5. If a person tests positive, what is the probability that the person has cancer? Express the probability as a percent and show your reasoning. 6. If a person tests negative, what is the probability that the person has cancer? Express the probability as a percent and show your reasoning. 1 Adapted from http://www.j-bradford-delong.net/movable_type/archives/001394.html 3 FALSE POSITIVES – Possible Solutions 1. How many people in the town have cancer? How many do not? We need to find 0.5% of 48,730. We can do that by changing 0.5% to a decimal and multiplying. 0.5% = 0.005 0.005(48,730) = 243.65 OR we can create a proportion to determine 0.5% of 48,730. Let x = the number of people in the town who have cancer. x total # people x 48,730 = % with disease 100 = 0.5 100 100x = (0.5)(48,730) 100x = 24,365 x = 243.65 Rounded to the nearest person: 244 people have cancer. Therefore, 48,730 – 244 = 48,486 people do not have cancer. 2. Of the people that do have cancer, how many will test positive on the screening? Let x = the number of people who test positive. A proportion or simple calculation can be used here: x total # with cancer = x 244 = % positive results 100 92 100 100x = 92(244) 100x = 22,448 x = 224.48 OR change 92% to its decimal form and calculate: 92% of 244 = 0.92(244) = 224.48 225 people with cancer will test positive. 4 3. Of those that do not have cancer, how many will test positive on the screening? Let x = the number who test positive x = total # without cancer x 48,486 = % positive results 100 8 100 100x = 8(48,486) 100x = 387,888 x = 3878.88 OR calculate using the decimal equivalent for 8%: 8% of 48,486 = 0.08(48,486) = 3878.88 3879 people who do not have cancer will test positive. 4. Create a two-way table to show all possible outcomes. Use your table to answer the questions that follow. An example of a 2-way table: Test Result: Yes Have cancer 225 Don’t have cancer 3,879 Total 4,104 Test Result: No 19 44,607 44,626 Total 244 48,486 48,730 5. If a person tests positive, what is the probability that the person does have cancer? Express the probability as a percent and show your reasoning. The student can create a ratio from the two-way table to determine the probability: Ratio: # with cancer total # positive results = 225 4,104 Probability = 0.055 = 5.5% of positive test results will actually have cancer. 6. If a person tests negative, what is the probability that the person has cancer? Express the probability as a percent and show your reasoning. Ratio: # negative with cancer total # negative = 19 44,626 Probability: 0.0004 = 0.04% of negative test results will actually have cancer. 5 FALSE POSITIVES - Possible Extensions The extensions below represent potential ways in which mathematics and/or CTE teachers can build on the task above. All of the extensions are optional and can be used in the classroom, as homework assignments, and/or as long-term interdisciplinary projects. 1. Strategize the best way to communicate the test results, including the accuracy of the test, within a healthcare environment. Select a particular target audience, and develop your communication strategies based on the needs of this audience. 2. Compare the reliability of this screening test to another cancer screen, found through research or offered by the teacher. 6 FALSE POSTIVES – Appendix: Alignment Ratings The rating system used in the following charts is as follows: 3 EXCELLENT ALIGNMENT: The content/performance of the task is clearly consistent with the content/performance of the Common Core State Standard. 2 GOOD ALIGNMENT: The task is consistent with important elements of the content/performance of the CCSS statement, but part of the CCSS is not addressed. 1 WEAK ALIGNMENT: There is a partial alignment between the task and the CCSS, however important elements of the CCSS are not addressed in the task. N/A: For Mathematical Practices a content rating does not apply. In the charts C = Content Rating and P = Performance Rating COLOR KEY Black = Part of CCSS/K&S Statement aligned to task Gray = Part of CCSS/K&S Statement not aligned to task 7 Task-to-Mathematical Practice Alignment Recording Sheet Task Name Aligned CCSS Mathematical Practice Standards FALSE POSITIVES MP.1 Make sense of problems and persevere in solving them MP.2 Reason abstractly and quantitatively C N/A N/A P Alignment Comments (Standards selection, partial alignments, reasons for rating, etc) 3 Students analyze givens, constraints, and relationships. They must make conjectures about the form and meaning of the solution and plan a solution pathway. They must make sure their answers make sense in the context of the problem. The students must persevere in order to determine which values are required for the questions. 3 Students make sense of quantities and their relationships in this problem situation. They must create a coherent representation of the problem at hand, considering units and attending to the meaning of quantities. They need to abstract a given quantity and decontextualize it to perform calculations, and then re-contextualize to express the answer in terms of the problem. MP.4 Model with mathematics N/A 2 Students are required to identify important quantities in a practical situation and demonstrate their relationships using a 2-way table. They then use those relationships and the table to answer questions posed in the context of the situation. MP.6 Attend to precision N/A 3 Students must calculate accurately and express answers with a degree of precision appropriate to the context. Task Comments (Strengths, weaknesses, possible improvements, effectiveness, etc) This is a multi-stage problem with real life applications and considerations. Students must identify quantities using practical situations, organize and analyze the given information, and perform accurate quantitative calculations. They must explain their reasoning and support their findings at various steps in the process. 8 Task-to-Common Core State Standards Alignment Recording Sheet FALSE POSTIIVES Task Name Aligned CCSS Content Standards C P Alignment Comments (Standards selection, partial alignments, reasons for rating, etc.) S.CP.4 Construct and interpret two-way frequency tables of data when two categories are associated with each object being classified. Use the two-way table as a sample space to decide if events are independent and to approximate conditional probabilities. For example, collect data from a random sample of students in your school on their favorite subject among math, science, and English. Estimate the probability that a randomly selected student from your school will favor science given that the student is in tenth grade. Do the same for other subjects and compare the results. 3 S.CP.6 Find the conditional probability of A given B as the fraction of B’s outcomes that also belong to A, and interpret the answer in terms of the model. 3 3 Questions 5 and 6 require knowledge of conditional probability. 7.RP.3 Use proportional relationships to solve multistep ratio and percent problems. 3 3 Proportional relationships and percentages are central to this task. 3 This task addresses compound events for which students must determine the sample spaces and in order to find a probability. 7.SP.8a Understand that, just as with simple events, the probability of a compound event is the fraction of outcomes in the sample space for which the compound event occurs. 7.SP.8b Represent sample spaces for compound events using methods such as organized lists, tables and tree diagrams. For an event described in everyday language (e.g., “rolling double sixes”), identify the outcomes in the sample space which compose the event. 3 3 2 3 This task involves data that are classified in two different ways. In Question 4 of the task students must create a 2-way table and use it to answer questions regarding probabilities associated with the values in the table. Task Comments (Strengths, weaknesses, possible improvements, effectiveness, etc.) This complex real-world task combines calculation, conversion between decimal and percent, and organization and analysis of information with explanation of mathematical thinking required to support results. In Question 4 of this task, students must create a 2-way table and use the values in the table to predict the outcomes for a described event. 9 Task-to-National Career Cluster Knowledge & Skills Statements Alignment Recording Sheet FALSE POSTITIVES Task Name Aligned National Career Cluster Knowledge & Skills Statements C P Alignment Comments HLCO3 Solve problems using critical thinking skills (analyze, synthesize, and evaluate) independently and in teams. Solve problems using creativity and innovation. 1 2 Students must use critical thinking skills to evaluate and solve the problem. Little creativity or innovation is required. While this task would likely be done independently, it could be done in teams. HLPB07.01.01 Evaluate procedures commonly used in providing diagnostic services. 2 2 Students are evaluating the reliability and accuracy of a certain treatment. 1 The problem is a simulation in collecting patient/client information; the information is provided in the task. HLPA03.01.01 Collect patient/client information compliant with facility and regulatory guidelines. 1 Task Comments The task uses the context of diseases and testing and false positives that result from tests and thus provides a realistic context for the calculations. 10
