142, Regression Modeling Data: Which fits the best?
advertisement
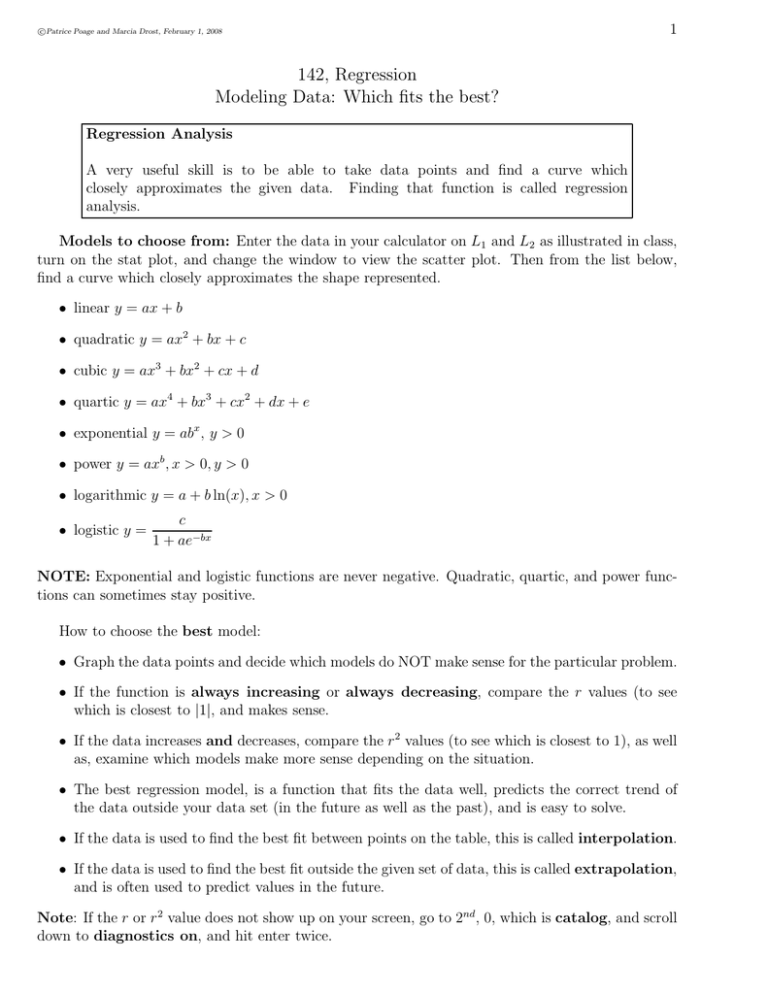
c Patrice Poage and Marcia Drost, February 1, 2008 1 142, Regression Modeling Data: Which fits the best? Regression Analysis A very useful skill is to be able to take data points and find a curve which closely approximates the given data. Finding that function is called regression analysis. Models to choose from: Enter the data in your calculator on L1 and L2 as illustrated in class, turn on the stat plot, and change the window to view the scatter plot. Then from the list below, find a curve which closely approximates the shape represented. • linear y = ax + b • quadratic y = ax2 + bx + c • cubic y = ax3 + bx2 + cx + d • quartic y = ax4 + bx3 + cx2 + dx + e • exponential y = abx , y > 0 • power y = axb , x > 0, y > 0 • logarithmic y = a + b ln(x), x > 0 • logistic y = c 1 + ae−bx NOTE: Exponential and logistic functions are never negative. Quadratic, quartic, and power functions can sometimes stay positive. How to choose the best model: • Graph the data points and decide which models do NOT make sense for the particular problem. • If the function is always increasing or always decreasing, compare the r values (to see which is closest to |1|, and makes sense. • If the data increases and decreases, compare the r 2 values (to see which is closest to 1), as well as, examine which models make more sense depending on the situation. • The best regression model, is a function that fits the data well, predicts the correct trend of the data outside your data set (in the future as well as the past), and is easy to solve. • If the data is used to find the best fit between points on the table, this is called interpolation. • If the data is used to find the best fit outside the given set of data, this is called extrapolation, and is often used to predict values in the future. Note: If the r or r 2 value does not show up on your screen, go to 2nd , 0, which is catalog, and scroll down to diagnostics on, and hit enter twice. 2 c Patrice Poage and Marcia Drost, February 1, 2008 EX 1: Mr. Jones runs advertisements at a TV station to promote his used car sales. He collects the data relating advertising spots and the # of cars he sells per month as shown below: x (# of ads run) y ( # of cars ) 7 14 20 26 30 35 14 20 25 28 29 29 40 30 (a) If you were only concerned with the given data points, which of the following 3 models gives the best fit and WHY: quadratic cubic logarithmic (b) If Mr. Jones wants to see long-term effects, which of the 3 models above makes the most sense then? Explain WHY. EX 2: Given the following data for average cost of a new home in thousands of dollars, let x represent the year 1960. Year Cost 1965 1968 1975 1980 1985 1990 1995 21.5 26.6 40.1 75.5 110.2 145.6 176.2 (a) Find the best fitting model, using quadratic, cubic, or logistic, and explain why you think this is the best model. (b) Using this model, predict the average cost in 2003.
