Hands-on Lab 2: LabVIEW – NI
advertisement

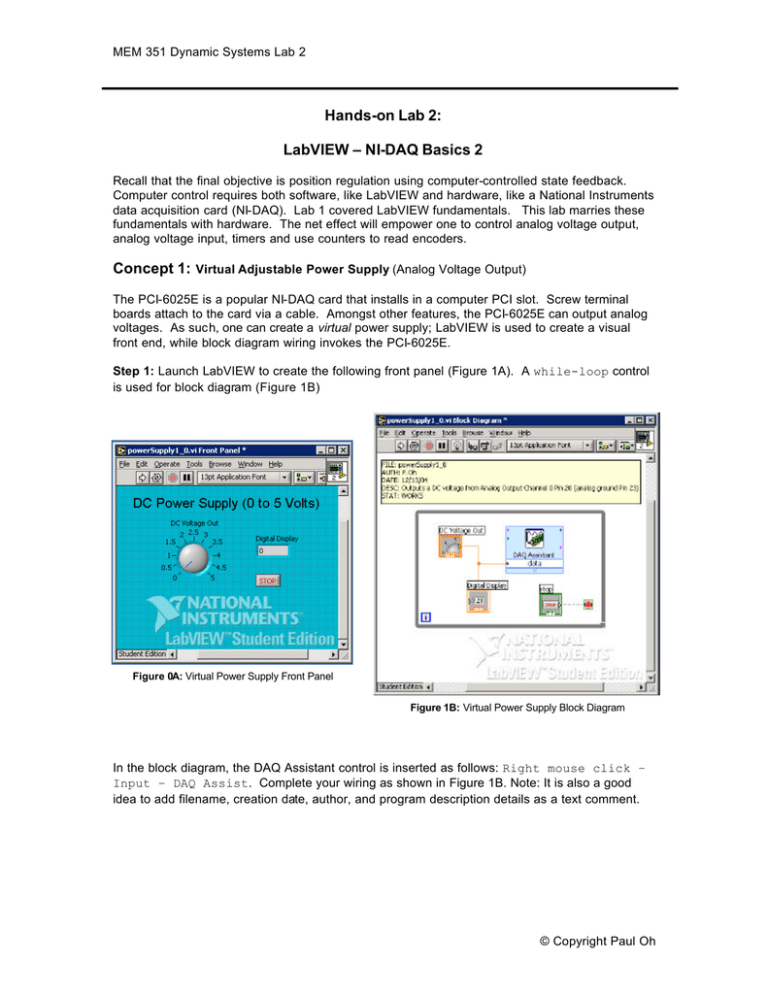
MEM 351 Dynamic Systems Lab 2 Hands-on Lab 2: LabVIEW – NI-DAQ Basics 2 Recall that the final objective is position regulation using computer-controlled state feedback. Computer control requires both software, like LabVIEW and hardware, like a National Instruments data acquisition card (NI-DAQ). Lab 1 covered LabVIEW fundamentals. This lab marries these fundamentals with hardware. The net effect will empower one to control analog voltage output, analog voltage input, timers and use counters to read encoders. Concept 1: Virtual Adjustable Power Supply (Analog Voltage Output) The PCI-6025E is a popular NI-DAQ card that installs in a computer PCI slot. Screw terminal boards attach to the card via a cable. Amongst other features, the PCI-6025E can output analog voltages. As such, one can create a virtual power supply; LabVIEW is used to create a visual front end, while block diagram wiring invokes the PCI-6025E. Step 1: Launch LabVIEW to create the following front panel (Figure 1A). A while-loop control is used for block diagram (Figure 1B) Figure 0A: Virtual Power Supply Front Panel Figure 1B: Virtual Power Supply Block Diagram In the block diagram, the DAQ Assistant control is inserted as follows: Right mouse click – Input – DAQ Assist. Complete your wiring as shown in Figure 1B. Note: It is also a good idea to add filename, creation date, author, and program description details as a text comment. © Copyright Paul Oh MEM 351 Dynamic Systems Lab 2 Step 2: Double-clicking the DAQ Assistant control in the block diagram will invoke the screen (Figure 2A). Choose Analog Output and then select Voltage. This will invoke the screen in Figure 2B. Note that PCI-6025E (the NI-DAQ hardware board) is listed under the “My Physical Channels” tree. Choose ao0 (analog output channel 0). Figure 2A: DAQ Assistant Welcome Screen Figure 2B: The PCI-6025E hardware is listed Step 3: Referring to Figure 3 below, configure the analog output for minimum and maximum voltages of 0 and 5 Volts respectively. Select the “Generate 1 Sample” option. Click OK. Figure 3: PCI-6025E Configuration screen © Copyright Paul Oh MEM 351 Dynamic Systems Lab 2 Step 4: Connect an actual voltmeter to screw terminal 20 (AO 0) and 23 (AO GND). Run your program and use the mouse to turn the knob. The output voltage as indicated on the front panel and your voltmeter should be the same. Exercise 1: In LabVIEW create programs for the following: 1-1. A virtual power supply ranging from –10 to +10 Volts 1-2. Displays the output voltage on a waveform chart (select Graph Inds – Chart) Concept 2: Virtual Voltmeter (analog voltage input) The PCI-6025E has 8 differential channels to acquire analog voltages. Constructing a virtual voltmeter only requires one differential channel. Step 1: Create the front panel and block diagram given in Figures 1A and 1B respectively. Figure 0A: Virtual voltmeter front panel Figure 2B: Virtual voltmeter block diagram In the lower left corner of the block diagram is a timer control. Create this as follows: Right Click – All Functions – Time & Dialog – “Wait Until Next ms Multiple”. The constant “100” sets the block to execute every 100 milliseconds. Step 2: Insert the DAQ Assistant control (Right mouse click – Input – DAQ Assist). Double-clicking the DAQ Assistant control in the block diagram will invoke the configuration screen. Choose Analog Input and select Voltage. This will invoke the screen in Figure 3. Under the Terminal Configuration pull-down menu, select “Differential”. The minimum and maximum voltages should be 0 and +10 Volts respectively. Again, the NI-DAQ PCI-6025E card listed under “My Physical Channels”. Choose a1 (analog channel 1). Choose the “Acquire Continuously” option with Samples to Read set at 100 and Rate of 1000 Hz. The clock rate should read Internal. Click OK to complete the configuration. © Copyright Paul Oh MEM 351 Dynamic Systems Lab 2 Figure 3: DAQ Assistant configuration screen for a virtual voltmeter Step 3: Connect a real adjustable power supply’s positive lead (red) to screw terminal screw terminal 5 (AI 1) and the negative lead (black) to screw terminal 6 (AI 9). Run the VI and observe the meter’s needle display the voltage. Exercise 2: 2-1. On one computer run the virtual power supply (from Concept 1). Wire the analog output voltage to your computer that runs the virtual voltmeter. © Copyright Paul Oh MEM 351 Dynamic Systems Lab 2 Concept 3: Virtual Data Recorder (File input/output) The data acquired can be stored to a hard disk file. As such, the virtual voltmeter in Concept 2 can be adapted into a virtual data recorder. Step 1: A very simple front panel is needed because all acquired data will be recorded into a file on your hard drive. This file will be read and plotted with Excel. Create the front panel shown in Figure 4A. Use a while-loop control to create the block diagram (Figure 4B). Figure 4A: Data Recorder front panel Figure 4B: Data Recorder block diagram The constant “25” associated with the timer sets the while-loop to execute every 25 milliseconds. A shift register variable that increments by 1 every iteration, is multiplied by 0.025 and is displayed in the front panel indicator labeled “Seconds Elapsed”. Step 2: Insert the DAQ Assistant control (Right mouse click – Input – DAQ Assist). Double-clicking the DAQ Assistant control in the block diagram will invoke the configuration screen. This time choose Analog Input and select Voltage. This will invoke the screen in Figure 4. Under the Terminal Configuration pull-down menu, select “Differential”. The minimum and maximum voltages should be –10 and +10 Volts respectively. Again, one should see the NI-DAQ PCI-6025E card listed under “My Physical Channels”. Choose a1 (analog channel 1). Click OK to complete the configuration. © Copyright Paul Oh MEM 351 Dynamic Systems Lab 2 Figure 4: Choose a1 under My Physical Channels Figure 5: LabVIEW Measurement file (LVM) screen Step 3: Acquired data is saved to a file on the hard disk. In the block diagram: Right-click – Output – Write LVM. Set your configuration screen to match the one given in Figure 5. Chose a directory and file name (e.g. daqFile.lvm) to save acquired data. Choose the “Overwrite File” option and make sure the “Tab” is the delimiter. Step 4: Attach a sinusoidal function generator to screw terminals 5 (AI 1) and 6 (AI 9). Set the function generator at 200 Hz with a +5 Volt amplitude. Run your program for about 5 seconds. The file daqFile.lvm should be in the directory you choose in Step 3. Open the data file with Excel. There are two columns, the leftmost is the elapsed time at every 0.025 seconds and the rightmost is the acquired voltage value. Plot the data to see the sine wave. Exercise 3: 3-1. 3-2. 3-3. 3-4. 3-5. What are the differences in the timer configurations used in Concepts 2 and 3? Eyeball the period and frequency of the Excel data plot. What are there values? Set the frequency to 80 Hz, acquire and plot the data. Explain the results. Set the frequency to 60 Hz, acquire and plot the data. Explain the results. In LabVIEW write a program that can correctly read a signal with a 40 Hz period © Copyright Paul Oh


