Student Activity: To investigate polynomials
Student Activity: To investigate polynomials
Use in connection with the interactive file, ‘Polynomials’, on the Student’s CD .
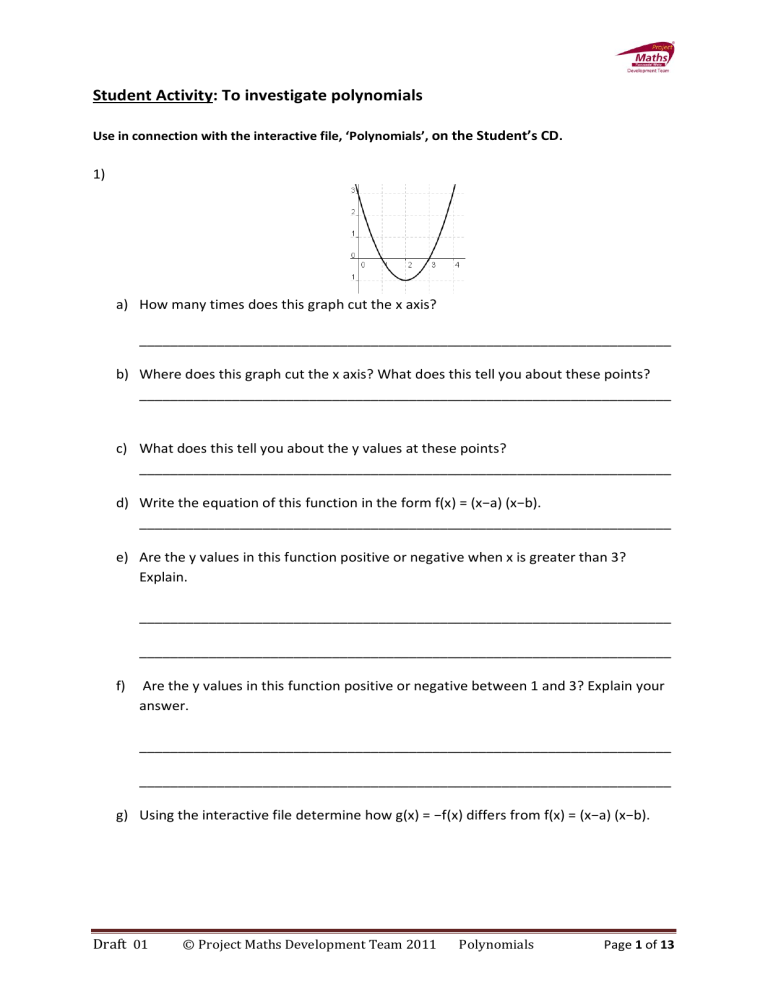
1) a) How many times does this graph cut the x axis?
_____________________________________________________________________ b) Where does this graph cut the x axis? What does this tell you about these points?
_____________________________________________________________________ c) What does this tell you about the y values at these points?
_____________________________________________________________________ d) Write the equation of this function in the form f(x) = (x−a) (x−b).
_____________________________________________________________________ e) Are the y values in this function positive or negative when x is greater than 3?
Explain.
_____________________________________________________________________
_____________________________________________________________________ f) Are the y values in this function positive or negative between 1 and 3? Explain your answer.
_____________________________________________________________________
_____________________________________________________________________ g) Using the interactive file determine how g(x) = −f(x) differs from f(x) = (x−a) (x−b).
Draft 01 © Project Maths Development Team 2011 Polynomials Page 1 of 13
h) What is the equation of the polynomial represented by the graph below?
2)
_____________________________________________________________________ a) Given the points A(a,0) and B(b,0) as shown in the diagram above, find the equation of the function represented in the diagram.
_____________________________________________________________________ b) Where are the y values increasing in this diagram?
_____________________________________________________________________
_____________________________________________________________________ c) Where are the y values decreasing in this diagram?
_____________________________________________________________________
_____________________________________________________________________
3) Given the polynomial is f(x) = (x−3) (x−4) (x−5), answer the following questions. a) What are the roots of f(x) = 0?
_____________________________________________________________________ b) i) For x = 5, what is the value of f(x)?
_____________________________________________________________________
Draft 01 © Project Maths Development Team 2011 Polynomials Page 2 of 13
ii) For x = 3, what is the value of f(x)?
_____________________________________________________________________ iii) For x = 4, what is the value of f(x)?
_____________________________________________________________________ iv) Plot these 3 points as part of the graph of f(x).
c) F or x > 5, i) What is the sign of (x−3)?
______________________________________________________________ ii) What is the sign of (x−4)?
_______________________________________________________________ iii) What is the sign of (x−5)?
_______________________________________________________________ iv) Hence what is the sign of f(x) = (x−3) (x−4) (x−5) for x>5 ?
_______________________________________________________________ v) Complete the graph already started above of f(x) = (x−3) (x−4) (x−5), for x>5. vi) Using the same reasoning as above what is the sign of f(x) for 4<x<5?
_______________________________________________________________ d) i) What is the sign of f(x) for 3<x<4?
_______________________________________________________________
Draft 01 © Project Maths Development Team 2011 Polynomials Page 3 of 13
ii) What is the sign of f(x) for x<3?
_______________________________________________________________ iii) Complete the graph already started above of f(x) = (x−3) (x−4) (x−5), for all values of x.
4) Given the polynomial is g(x) = (x−2) (x−3) (x−4), answer the following questions. a) What are the roots of g(x) = 0?
_______________________________________________________________ b) What is the largest root r of g(x)?
_______________________________________________________________ c) What is the value of g(r) where r is the largest root of g(x) = 0?
_______________________________________________________________ d) What is r+1 and what value has g(r+1)?
_______________________________________________________________ e) Is g(r+1) positive or negative?
_______________________________________________________________ f) What is the sign of g(x) when x>r?
______________________________________________________________ g) Hence is the graph of the polynomial g(x) when x> r increasing or decreasing?
_______________________________________________________________ h) Which of the following is the shape of the polynomial when x>4?
_______________________________________________________________ i) Complete a sketch of y = g(x) = (x−2) (x−3) (x−4). Note it is only a sketch and exact heights are not required.
Draft 01 © Project Maths Development Team 2011 Polynomials Page 4 of 13
j) Using the interactive file determine the shape of the graph h(x) = −g(x)?
5) Given the polynomial is g(x) = (x−2) (x−1) (x−4), answer the following questions. a) What are the roots of g(x) = 0?
_______________________________________________________________ b) What is the largest root r of g(x)?
_______________________________________________________________ c) What is the value of g(r) where r is the largest root of g(x) = 0?
_______________________________________________________________ d) What is r+1 and what value has g(r+1)?
_______________________________________________________________
Draft 01 © Project Maths Development Team 2011 Polynomials Page 5 of 13
e) Is g(r+1) positive or negative?
_______________________________________________________________ f) What is the sign of g(x) when x>r?
_______________________________________________________________ g) Hence is the graph of the polynomial g(x) when x> r increasing or decreasing?
_______________________________________________________________ h) What is the shape of the polynomial when x>4?
_______________________________________________________________ i) Complete a sketch of y = g(x) = (x−2) (x−1) (x−4). Note it is only a sketch and exact heights are not required. j) Using the interactive file determine the shape of the graph h(x) = −g(x)?
Draft 01 © Project Maths Development Team 2011 Polynomials Page 6 of 13
6) Given the polynomial is g(x) = (x+2) (x+1) (x−2), answer the following questions. a) What are the roots of g(x) = 0?
_______________________________________________________________ b) What is the largest root r of g(x)?
_______________________________________________________________ c) What is the value of g(r) where r is the largest root of g(x) = 0?
_______________________________________________________________ d) What is r+1 and what value has g(r+1)?
_______________________________________________________________ e) Is g(r+1) positive or negative?
_______________________________________________________________ f) What is the sign of g(x) when x>r?
_______________________________________________________________
_______________________________________________________________ g) Hence is the graph of the polynomial g(x) when x> r increasing or decreasing?
_______________________________________________________________ h) What is the shape of the polynomial when x>2?
________________________________________________________________
________________________________________________________________ i) Complete a sketch of y = g(x) = (x+2) (x+1) (x−2). Note it is only a sketch and exact heights are not required.
Draft 01 © Project Maths Development Team 2011 Polynomials Page 7 of 13
j) Using the interactive file determine the shape of the graph h(x) = −g(x)?
7) Using the interactive file determine the shape of the graph that represent s(x) = (x−a) (x−b), when both a and b are equal to 2. Sketch the graph. a.
When x>2 what is the sign of y=s(x)?
_______________________________________________________________ b.
When x<2 what is the sign of y=s(x)?
_______________________________________________________________
8) With the help of the interactive file sketch the graph of the function f(x) = (x−2) (x−2) (x−3) (x−4) = (x−2)
2
(x−3) (x−4).
Draft 01 © Project Maths Development Team 2011 Polynomials Page 8 of 13
g.
h.
a.
b.
c.
d.
e.
f.
Is this graph positive or negative for x >4?
_______________________________________________________________
What happens to this graph at x = 4?
_______________________________________________________________
What happens to this graph between 3 and 4?
_______________________________________________________________
What happens to this graph at 3?
_______________________________________________________________
What happens to this graph between 2 and 3?
_______________________________________________________________
What happens to this graph at 2?
_______________________________________________________________
What happens to this graph between 1 and 2?
_______________________________________________________________
Using the interactive file determine the shape of the graph h(x) = −g(x)?
Draft 01 © Project Maths Development Team 2011 Polynomials Page 9 of 13
9) Sketch the graph of the polynomial p(x) = (x−1)
2
(x−2) (x−3).
10) Sketch the graph of the polynomial p(x) = (x−1) (x−2)
2
(x−3).
Draft 01 © Project Maths Development Team 2011 Polynomials Page 10 of 13
11)
12) a.
Where does this graph cut the x axis? What does this tell you about these points?
_______________________________________________________________ b.
What is the equation of this graph?
_______________________________________________________________ c.
For what values of x is this graph positive and increasing?
_______________________________________________________________ d.
For what values of x is this graph positive and decreasing?
_______________________________________________________________ e.
For what values of x is this graph negative and increasing?
_______________________________________________________________ f.
For what values of x is this graph negative and decreasing?
_______________________________________________________________ a.
Where does this graph cut the x axis? What does this tell you about these points?
_______________________________________________________________
Draft 01 © Project Maths Development Team 2011 Polynomials Page 11 of 13
13) b.
How many times does this graph cut the x axis?
_______________________________________________________________ c.
For what values of x is this graph positive and increasing?
_______________________________________________________________
_______________________________________________________________ d.
For what values of x is this graph positive and decreasing?
_______________________________________________________________
_______________________________________________________________ e.
For what values of x is this graph negative and increasing?
_______________________________________________________________
_______________________________________________________________ f.
For what values of x is this graph negative and decreasing?
_______________________________________________________________
_______________________________________________________________ g.
What is the equation of this graph? Check your answer using the interactive file.
_______________________________________________________________ a.
Sketch the graph f(x) = (x−2) (x−2) (x−2) (x−1) (x−4) = (x−2)
3
(x−1) (x−4). b.
What happens to the graph at x=2?
_______________________________________________________________
Draft 01 © Project Maths Development Team 2011 Polynomials Page 12 of 13
14) Sketch the graph g(x) = (x+2) (x−2) (x−2) (x+1) (x−4) = (x+2) (x−2)
2
(x+1) (x−4).
15) What is the equation of the polynomial where the highest power of x is 5, represented by the following graph?
_______________________________________________________________
16) What is the equation of the polynomial where the highest power of x is 7, represented by the following graph?
_______________________________________________________________
Draft 01 © Project Maths Development Team 2011 Polynomials Page 13 of 13

