Introduction to the Nyquist criterion The Nyquist criterion relates the
advertisement

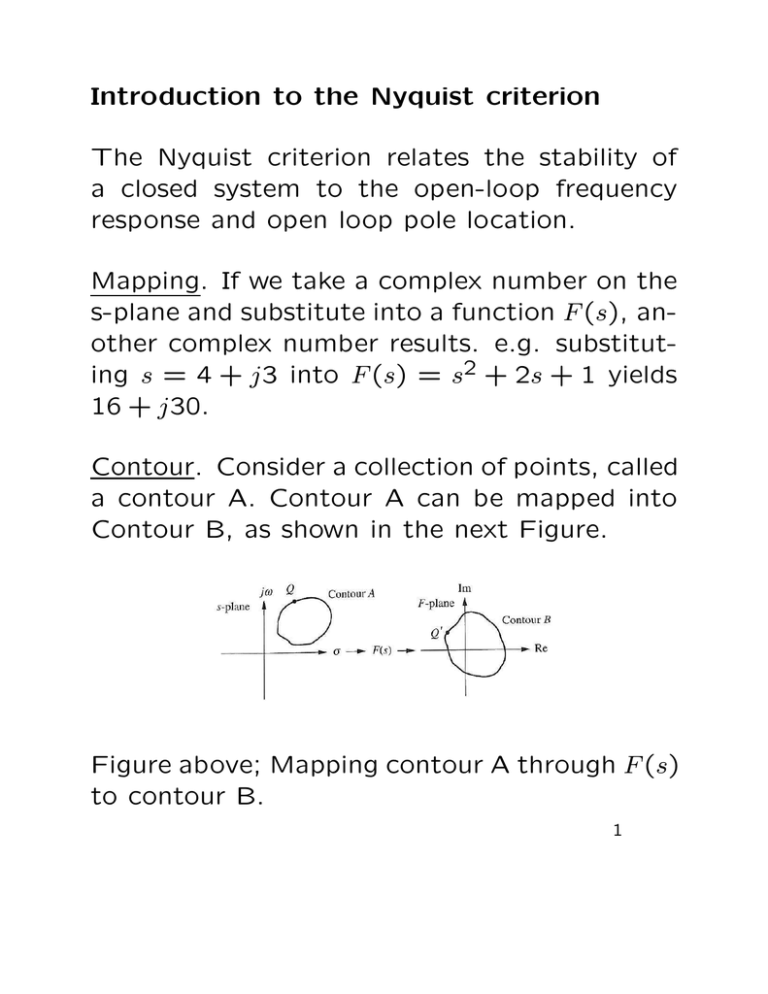
Introduction to the Nyquist criterion The Nyquist criterion relates the stability of a closed system to the open-loop frequency response and open loop pole location. Mapping. If we take a complex number on the s-plane and substitute into a function F (s), another complex number results. e.g. substituting s = 4 + j3 into F (s) = s2 + 2s + 1 yields 16 + j30. Contour. Consider a collection of points, called a contour A. Contour A can be mapped into Contour B, as shown in the next Figure. Figure above; Mapping contour A through F (s) to contour B. 1 Assuming (s − z1)(s − z2) · · · F (s) = (s − p1)(s − p2) · · · If we assume a clockwise direction for mapping the points on contour A, the contour B maps in a clockwise direction if F (s) has just one zero. If the zero is enclosed by contour A, then contour B enclose origin. Alternatively, the mapping is in a counterclockwise direction if F (s) has just one pole, and if the pole is enclosed by contour A, then contour B enclose origin. If there is the one pole and one zero is enclosed by contour A, then contour B does not enclose origin. 2 Figure above; Examples of contour mapping. 3 Consider the system in the Figure below. Figure above; closed loop control system Letting G(s) = NG N , H(s) = H , DG DH We found T (s) = G(s) NGDH = 1 + G(s)H(s) DGDH + NGNH Note that DGDH + NGNH 1 + G(s)H(s) = DGDH 4 The poles of 1 + G(s)H(s) are the same as the poles of G(s)H(s), the open-looped system, that are known. The zeros of 1 + G(s)H(s) are the same as the poles of T (s), the closedlooped system, that are unknown. Because stable systems have T (s) with poles only in the left half-plane, we apply the concept of contour to use the entire right half-plane as contour A, as shown in the Figure below. Figure above; Contour enclosing right halfplane to determine stability. 5 We try to construct contour B via F (s) = G(s)H(s) which is the same as that of 1 + G(s)H(s), except that it is shifted to the right by (1, j0). The mapping is called the Nyquist diagram of G(s)H(s). Assuming that A starts from origin, A is a path traveling up the jω axis, from j0 to j∞, then a semicircular arc, with radius → ∞, followed by a path traveling up the jω axis, from −j∞ to origin. So substituting s = jω, with ω changing from 0 to ∞, we obtain part of contour B, which is exactly the polar plot of G(s)H(s). 6 Each zero or pole of 1 + G(s)H(s) that is inside contour A (the right half-plane), yields a rotation around (−1, j0) (clockwise for zero and counterclockwise for pole) for the resultant Nyquist diagram. The total number of counterclockwise revolution, N , around (−1, j0) is N = P − Z, where P is the number of openloop poles,and Z is the number of closed loop poles. Thus we determine that that the number of closed loop poles, Z, in the right half-plane equals the number of open-loop poles, P , that are in the right half-plane minus the number of counterclockwise revolution, N , around −1 of the mapping, i.e. Z = P − N . Use Nyquist criterion to determine stability If P = 0 (open loop stable system), for a closed systems to be stable (i.e. Z = 0), we should have N = 0. That is, the contour should not enclose (−1, j0). This is as shown in next Figure (a). 7 On the other hand, another system with P = 0 (open loop stable) has generated two clockwise encirclement of (−1, j0), (N = −2), as shown in Figure (b) below. Thus Z = P − N = 2. The system is unstable with two closed-loop poles in the right hand plane. Figure above; Mapping examples: (a) contour does not enclose closed loop poles; (b) contour does enclose closed loop poles; 8 Example: Apply the Nyquist criterion to determine the stability of the following unit-feedback systems with (i) s+3 G(s) = . (s + 2)(s2 + 2s + 25) s + 20 . (s + 2)(s + 7)(s + 50) (ii) G(s) = (iii) 500(s − 2) G(s) = . (s + 2)(s + 7)(s + 50) Solution: For (i) and (ii), check polar plots in the previous lecture. For both systems we have P = 0 (open loop stable system). The two nyquist plots does not enclose (−1, j0), (N=0) Thus Z = P −N = 0. Both systems (i) and (ii) are stable since there are no close-loop poles in the right half plane. 9 For (iii), we run ≫ numg=500* [1 -2];; ≫ deng=conv([1 2],[1 7]); ≫ deng=conv(deng,[1 50]); ≫ G=tf(numg,deng); ≫ nyquist(G); ≫ grid on; Nyquist Diagram 1.5 2 dB 0 dB −2 dB −4 dB 4 dB 1 6 dB Imaginary Axis 0.5 −6 dB 10 dB −10 dB 20 dB −20 dB 0 −0.5 −1 −1.5 −1.5 −1 −0.5 0 Real Axis 0.5 1 1.5 Figure above; The polar plots for G(s) = 500(s − 2) . (s + 2)(s + 7)(s + 50) We have P = 0 (open loop stable system), but N = −1, so System (iii) is unstable with one closed loop pole in the right half plane. 10


