Initial Measurements of CSR from a Bunch-Compressed
advertisement

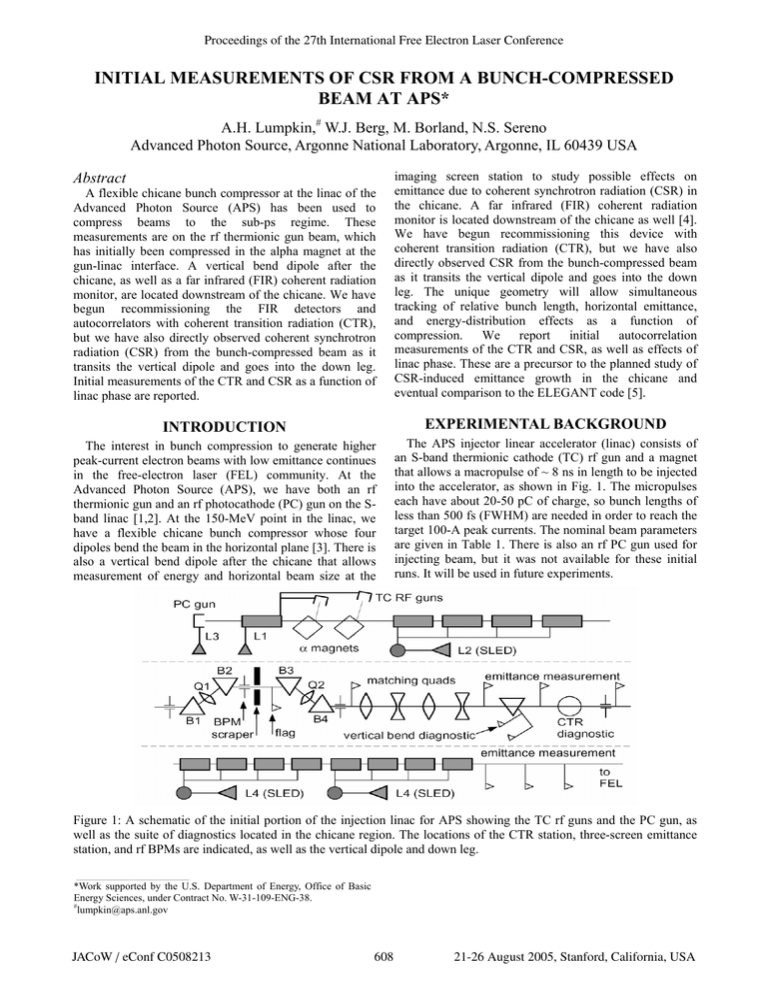
Proceedings of the 27th International Free Electron Laser Conference INITIAL MEASUREMENTS OF CSR FROM A BUNCH-COMPRESSED BEAM AT APS* A.H. Lumpkin,# W.J. Berg, M. Borland, N.S. Sereno Advanced Photon Source, Argonne National Laboratory, Argonne, IL 60439 USA Abstract A flexible chicane bunch compressor at the linac of the Advanced Photon Source (APS) has been used to compress beams to the sub-ps regime. These measurements are on the rf thermionic gun beam, which has initially been compressed in the alpha magnet at the gun-linac interface. A vertical bend dipole after the chicane, as well as a far infrared (FIR) coherent radiation monitor, are located downstream of the chicane. We have begun recommissioning the FIR detectors and autocorrelators with coherent transition radiation (CTR), but we have also directly observed coherent synchrotron radiation (CSR) from the bunch-compressed beam as it transits the vertical dipole and goes into the down leg. Initial measurements of the CTR and CSR as a function of linac phase are reported. imaging screen station to study possible effects on emittance due to coherent synchrotron radiation (CSR) in the chicane. A far infrared (FIR) coherent radiation monitor is located downstream of the chicane as well [4]. We have begun recommissioning this device with coherent transition radiation (CTR), but we have also directly observed CSR from the bunch-compressed beam as it transits the vertical dipole and goes into the down leg. The unique geometry will allow simultaneous tracking of relative bunch length, horizontal emittance, and energy-distribution effects as a function of compression. We report initial autocorrelation measurements of the CTR and CSR, as well as effects of linac phase. These are a precursor to the planned study of CSR-induced emittance growth in the chicane and eventual comparison to the ELEGANT code [5]. INTRODUCTION EXPERIMENTAL BACKGROUND The interest in bunch compression to generate higher peak-current electron beams with low emittance continues in the free-electron laser (FEL) community. At the Advanced Photon Source (APS), we have both an rf thermionic gun and an rf photocathode (PC) gun on the Sband linac [1,2]. At the 150-MeV point in the linac, we have a flexible chicane bunch compressor whose four dipoles bend the beam in the horizontal plane [3]. There is also a vertical bend dipole after the chicane that allows measurement of energy and horizontal beam size at the The APS injector linear accelerator (linac) consists of an S-band thermionic cathode (TC) rf gun and a magnet that allows a macropulse of ~ 8 ns in length to be injected into the accelerator, as shown in Fig. 1. The micropulses each have about 20-50 pC of charge, so bunch lengths of less than 500 fs (FWHM) are needed in order to reach the target 100-A peak currents. The nominal beam parameters are given in Table 1. There is also an rf PC gun used for injecting beam, but it was not available for these initial runs. It will be used in future experiments. Figure 1: A schematic of the initial portion of the injection linac for APS showing the TC rf guns and the PC gun, as well as the suite of diagnostics located in the chicane region. The locations of the CTR station, three-screen emittance station, and rf BPMs are indicated, as well as the vertical dipole and down leg. ___________________________________________ *Work supported by the U.S. Department of Energy, Office of Basic Energy Sciences, under Contract No. W-31-109-ENG-38. # lumpkin@aps.anl.gov JACoW / eConf C0508213 608 21-26 August 2005, Stanford, California, USA Proceedings of the 27th International Free Electron Laser Conference Table 1: APS linac beam properties at the chicane in the low-emittance mode. rf Frequency 2856 Beam Energy (MeV) 125-150 Micropulse Charge (pC) 20-50 Micropulse Duration (fs) 200-1000 (FWHM) Macropulse Length (ns) 8 Macropulse Repetition Rate (Hz) 6 Normalized Emittance (mm mrad) 15±4 At the 50-MeV point, we have a CTR measurement station that has been used in the past to optimize the rf gun performance [6,7]. An aluminum mirror is used as the CTR generator just as at the chicane location. The radiation leaves the beam pipe through a crystalline quartz window and is collimated by a 100-mm focal length crystalline quartz (z-cut) plano-convex lens. A Michelson interferometer is used to analyze the spectrum of the coherent radiation or, equivalently, to perform an autocorrelation of the emitted CTR or CSR pulse as described previously [6]. An Inconel-coated beam splitter is used to generate the two beams used in the autocorrelation. One beam’s path length can be adjusted by a computer-controlled mirror stage. A Golay detector, Model OAD-7, obtained from QMC Instruments Limited, was used as the broadband FIR detector. The analog data were processed and digitized with a Hewlett-Packard waveform digitizer. EPICS was the platform used to track the signal-versus-mirror position, the α-magnet current, and other parameters. The longitudinal profile was evaluated from the fast Fourier transform (FFT) of the autocorrelation and the use of the minimal phase approximation [8]. In the case of the post-chicane location, a suite of diagnostics is available, as shown also in Fig. 1. In addition to the FIR detector, the three-screen emittance measuring station and the screens in the down leg that measure the energy distribution (vertical) and the horizontal beam size are shown. These diagnostics will eventually be used in our CSR-induced emittance degradation studies. EXPERIMENTAL RESULTS AND DISCUSSION CTR Measurements at 50 MeV The initial compression process occurs in the α-magnet and is dependent on α-magnet current and gun rf phase and amplitude. We operated the rf thermionic gun in the high-charge mode at 500 mA compared to the normal injection set up to provide beam to the storage ring. The auto correlation of the CTR is shown in Fig. 2. Its FWHM is about 150 μm. This corresponds to 300 μm in optical path length or 990 fs. The data are processed, and the longitudinal profile reconstruction is shown in Fig. 3. The 21-26 August 2005, Stanford, California, USA 609 DC subtracted processing gives a resulting bunch length of about 450 fs (FWHM). Figure 2: The CTR autocorrelation from the FIR interferometer at the 50-MeV point. Figure 3: The longitudinal bunch profiles derived from the corrected autocorrelation amplitude spectrum using CTR from the 50-MeV point. CTR Measurements at 150 MeV The second CTR station is located after the chicane where the energy is about 150 MeV. Again an Al mirror is used as a CTR generator in the normal configuration where the beam is directed on through the linac. An additional compression of about a factor of 2.3 has been done as seen in the width of the CTR autocorrelation in Fig. 4 with a FWHM = 62 μm. This corresponds to 124 μm in optical path length or 409 fs. The details of this effect are confirmed in the longitudinal profile reconstruction shown in Fig. 5. The 200-fs FWHM is clearly two times shorter than that in Fig. 3. CSR Measurements at 150 MeV First, we want to clarify that these particular CSR measurements are based on measuring the FIR signal when the down dipole after the chicane is powered. Therefore, these are CSR measurements of the total bunch length in analogy to the CTR measurements of the JACoW / eConf C0508213 Proceedings of the 27th International Free Electron Laser Conference previous subsection. In this case the in-vacuum Al mirror of the CTR station just reflects by 90° the FIR CSR light generated at the dipole that proceeds on a tangent to the beam trajectory and strikes the mirror. The e-beam is indeed in the down leg as confirmed by the down-leg imaging screens. The point is that we are establishing a capability to monitor relative bunch length as the e-beam is simultaneously evaluated for energy and beam size in the down leg. The initial CSR autocorrelation is shown in Fig. 6 with longitudinal profile reconstruction in Fig. 7. There are strong similarities to the CTR results of the previous subsection although the signal is about 10 times weaker. The autocorrelation has a width of 61 μm. This corresponds to 122 μm in optical path length or 403 fs (FWHM). Figure 6: The CSR autocorrelation from the FIR interferometer at the 150-MeV point. The width of 61 μm is very close to the CTR result. The step size is 5 μm in this case. Figure 4: The CTR autocorrelation from the FIR interferometer at the 150-MeV point. Figure 7: The longitudinal bunch profile derived from the corrected autocorrelation amplitude spectrum using CSR from the 150-MeV point. CTR and CSR Phase Dependence Figure 5: The longitudinal bunch profile derived from the corrected autocorrelation amplitude spectrum using CTR from the 150-MeV point. JACoW / eConf C0508213 610 We have performed an initial, simple phase-dependence study by varying the L1 phase. Table 2 summarizes these results and shows that the CSR and CTR signal strengths vary similarly with phase. This is graphically shown in the plot of Fig. 8. This would be expected since they both are monitoring the coherent radiation from the same bunch length that results from the compression process. 21-26 August 2005, Stanford, California, USA Proceedings of the 27th International Free Electron Laser Conference Table 2: Comparison of initial CSR test data and CTR data from compressed 150-MeV electron beams. The vertical bend dipole current is the L3:AM1 column. L3:AM1 L1 Phase L3:CSR (A) (degrees) (Intensity)† +4.5 45.6 9±1 0.5 45.6 4.2 ± 0.4 -5.5 45.6 1.6 ± 0.3 +4.5 45.6 9.5 ± 0.5 L3:CTR† +4.5 0.0 63 ± 5 0.6 0.0 35 ± 3 -5.8 0.0 7±1 † Same FIR detector is used. The metal mirror generates CTR or reflects CSR. SUMMARY In summary, we have described a set of e-beam bunchlength measurements based on both FIR CTR and CSR. We have also shown clear evidence of compression in the chicane by comparing the CTR autocorrelations taken before and after the chicane. In addition, we have shown the CSR autocorrelation based on radiation from the beam transiting the vertical dipole located after the chicane. These measurements are a prelude to future experiments with a PC gun beam and investigation of CSR-induced emittance growth in the bunch-compression process. ACKNOWLEDGMENTS The authors acknowledge the support of O. Singh and W. Ruzicka of AOD/APS. REFERENCES Figure 8: A comparison plot showing the similar phase dependence of the CTR and CSR signals measured after the chicane. This is based on the entries of Table 2. 21-26 August 2005, Stanford, California, USA 611 [1] J.W. Lewellen et al., Proc. of the 1998 Linac Conference, ANL-98/28, 863 (1998). [2] S. Biedron et al., Proc. of the IEEE 1999 Particle Accelerator Conference, New York, NY, 2024 (1999). [3] M. Borland, J.W. Lewellen, and S.V. Milton, Proc. of the XX International Linear Accelerator Conference (LINAC2001), SLAC-R-561, 863 (2001). [4] A.H. Lumpkin et al., Proc. of the 2003 Particle Accelerator Conference, Portland, OR, 2420 (2003). [5] M. Borland, “ELEGANT: A Flexible SDDSCompliant Code for Accelerator Simulation,” LS-287, Argonne National Laboratory, September 2000. [6] A.H. Lumpkin et al., Nucl. Instrum. Methods, A475, 476 (2001). [7] A.H. Lumpkin, N.S. Sereno, D.W. Rule, Nucl. Instrum. Methods, A475, 470 (2001). [8] R. Lai, A.J. Sievers, AIP Conf. Proc. 367, 31 (1996). JACoW / eConf C0508213


