Explanatory note – “White”, “Grey” and “Black List”
advertisement

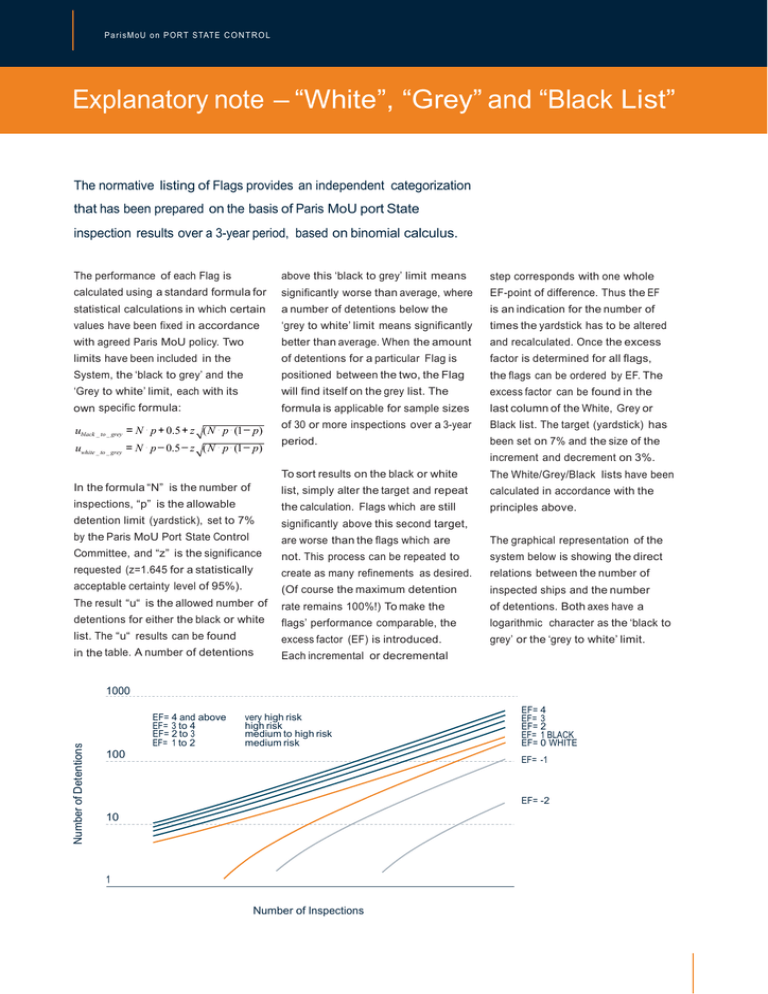
P a r i s M o U o n P O R T S TAT E C O N T R O L Explanatory note – “White”, “Grey” and “Black List” The normative listing of Flags provides an independent categorization that has been prepared on the basis of Paris MoU port State inspection results over a 3-year period, based on binomial calculus. The performance of each Flag is above this ‘black to grey’ limit means step corresponds with one whole calculated using a standard formula for significantly worse than average, where EF-point of difference. Thus the EF statistical calculations in which certain a number of detentions below the is an indication for the number of values have been fixed in accordance ‘grey to white’ limit means significantly times the yardstick has to be altered with agreed Paris MoU policy. Two better than average. When the amount and recalculated. Once the excess limits have been included in the of detentions for a particular Flag is factor is determined for all flags, System, the ‘black to grey’ and the positioned between the two, the Flag the flags can be ordered by EF. The ‘Grey to white’ limit, each with its will find itself on the grey list. The excess factor can be found in the own specific formula: formula is applicable for sample sizes last column of the White, Grey or ublack _ to _ grey = N ⋅ p + 0.5 + z ( N ⋅ p ⋅ (1 − p) of 30 or more inspections over a 3-year Black list. The target (yardstick) has period. been set on 7% and the size of the increment and decrement on 3%. uwhite _ to _ grey = N ⋅ p − 0.5 − z ( N ⋅ p ⋅ (1 − p) To sort results on the black or white The White/Grey/Black lists have been In the formula “N” is the number of list, simply alter the target and repeat calculated in accordance with the inspections, “p” is the allowable the calculation. Flags which are still principles above. detention limit (yardstick), set to 7% significantly above this second target, by the Paris MoU Port State Control are worse than the flags which are The graphical representation of the Committee, and “z” is the significance not. This process can be repeated to system below is showing the direct requested (z=1.645 for a statistically create as many refinements as desired. relations between the number of acceptable certainty level of 95%). (Of course the maximum detention inspected ships and the number The result “u“ is the allowed number of rate remains 100%!) To make the of detentions. Both axes have a detentions for either the black or white flags’ performance comparable, the logarithmic character as the ‘black to list. The “u“ results can be found excess factor (EF) is introduced. grey’ or the ‘grey to white’ limit. in the table. A number of detentions Each incremental or decremental 1000 Number of Detentions EF= 4 and above EF= 3 to 4 EF= 2 to 3 EF= 1 to 2 very high risk high risk medium to high risk medium risk 100 EF= -1 EF= -2 10 1 Number of Inspections EF= 4 EF= 3 EF= 2 EF= 1 BLACK EF= 0 WHITE Explanatory note – “White”, “Grey” and “Black List” Example flag on Black list: To determine the excess factor the following formula Ships of Flag A were subject to 108 inspections of is used: ef = Detentions – grey to white limit / grey to which 25 resulted in a detention. The “black to grey limit” black limit – grey to white limit is 12 detentions. The excess factor is 4.26. P = 7% ef = (10 − 4) / (15 − 4) ef = 0, 51 Q = 3% Example flag on White list: Z = 1.645 Ships of Flag C were subject to 297 inspections of which N = total inspections 11 resulted in detention. The “grey to white limit” is 13 How to determine the black to grey limit: detentions. The excess factor is –0.28. How to determine µ blacktogrey = N ⋅ p + 0.5 + z N ⋅ p ⋅ (1 − p) the grey to white limit: µ blacktogrey = 108 ⋅ 0.07 + 0.5 +1.645 108 ⋅ 0.07 ⋅ 0.93 µ greytowhite = N ⋅ p − 0, 5 − z N ⋅ p(1 − p) µ blacktogrey = 12 µ greytowhite = 297 ⋅ 0.07 − 0.5 −1.645 297 ⋅ 0.07 ⋅ 0.93 µ greytowhite = 13 The excess factor is 4.26. This means that ‘p’ has to be adjusted in the formula. The black to grey limit has an The excess factor is - 0.28 This means that ‘p’ has to be excess factor of 1. so to determine the new value for ‘p’. adjusted in the formula. The grey to white limit has an ‘q’ has to be multiplied with 3.26 and the outcome has to excess factor of 0. so to determine the new value for ’p’. be added to the normal value for ‘p’: ‘q’ has to be multiplied with –0.28. and the outcome has to be added to the normal value for ‘p’: p + 3, 26q = 0, 07 + (3, 26 ⋅ 0, 03) = 0,1678 µ excessfactor = 108 ⋅ 0.1678 + 0.5 +1.645 108 ⋅ 0.1678 ⋅ 0.8322 p + (−0.28q) = 0.07 + (−0.28 ⋅ 0.03) = 0.0616 µ excessfactor = 297 ⋅ 0.0616 − 0.5 −1.645 297 ⋅ 0.0616 ⋅ 0.9384 µ excessfactor = 25 µ excessfactor = 11 Example flag on Grey list: Ships of Flag B were subject to 141 inspections. of which 10 resulted in a detention. The ‘ black to grey limit” is 15 and the “ grey to white limit” is 4. The excess factor is 0.51. How to determine the black to grey limit: µ blacktogrey = 141⋅ 0.07 + 0.5 +1.645 141⋅ 0.07 ⋅ 0.93 µ blactogrey = 15 How to determine the grey to white limit: µ greytowhite = N ⋅ p − 0.5 − z N ⋅ p ⋅ (1 − p) µ greytowhite = 141⋅ 0.07 − 0.5 −1.645 141⋅ 0.07 ⋅ 0.93 µ greytowhite = 4 Explanatory note – “Commitment” Commitment: Member States of the Paris MoU are committed to perform inspections according to the inspection and selection scheme as defined in Annexes 8 and 11 of Paris Memorandum of Understanding. The number of inspections relevant for this commitment is calculated accordingly.


