Anisotropic optical properties of single
advertisement
Z. Phys. B 96, 313-318 (1995)
ZEITSCHRIFT
FORPHYSIKB
9 Springer-Verlag 1995
Anisotropic optical properties of single-crystal
GdBa2Cu307_ a
V. Zelezny 1, D.B. Tanner 1, K. Kamarfis 2, L.P. Kozeeva 3, A.A. Pavlyuk 3
1Department of Physics, Universityof Florida, Gainesville,FL 32611, USA
2 Research Institute for Solid State Physics of the Hungarian Academyof Sciences, Budapest, Hungary
3Institute of Inorganic Chemistry,Lavrenteva 3, 630090 Novosihirsk, Russia
Received: 20 June 1994
Abstract.
The optical spectrum of reduced-Tc
GdBa2Cu307_~ has been measured for polarizations parallel and perpendicular to the ab plane. The sample was
an oxygen-deficient single crystal with a large face containing the c axis. The polarized reflectance from this face
was measured from 20 300 K in the spectral region from
30-3000cm-1, with 300K data to 30000cm-1.
Kramers-Kronig analysis was used to determine the
spectral dependence of the a b and the c components of
the dielectric tensor. The optical properties are strongly
anisotropic. The a b-plane response resembles that of other reduced-Tc materials whereas the c axis, in contrast,
shows only the presence of several phonons. There is a
complete absence of charge carrier response along c
above and below T~. This observation allows us to set an
upper limit to the free-carrier spectral weight for transport perpendicular to the CuO2 planes.
PACS: 74.30.Gn; 74.70.Vy; 78.30.Er; 78.65.Ez
I. Introduction
The amount of anisotropy between the highly-conducting
ab planes and the perpendicular c axis in the oxide su-
perconductors is important because it is related to the
effective dimensionality of these materials. In turn, the
dimensionality has implications for the theoretical approach that describes the electronic structure. For example, if the high Tc superconductors are basically anisotropic three-dimensional solids, then one can imagine
them to have a Fermi surface and may take a Fermiliquid approach towards their properties. In this context,
we note that band-structure calculations [ 1] give metallic
behavior in all three directions. If, in contrast, they are
highly two dimensional, then the Fermi-liquid approach
may not be appropriate. Conventional electronic theory
* Permanent address: Institute of Physics, CSAV, Prague,
Czechoslovakia
does not permit a system to be metallic in two directions
and insulating (or localized) in a third [2, 3].
Electrical transport measurements find that the c-axis
has a much smaller conductivity than the ab plane [4].
In a few samples, notably fully oxygenated YBazCu30 7_~,
the electrical resistance appears to be rather metallic
( d p c / d T > 0) along c, suggesting anisotropic three-dimensional behavior [5, 6]. However other YBa2CU3OT_~
samples and other oxide superconductors are more two
dimensional, with resistance metallic in the ab plane and
insulating along c [7]. Indeed, Forro et al. [8] argue on
the basis of pressure studies that the c-axis transport is
diffusive even in samples for which d p c / d T is positive.
Polarized optical spectroscopy can provide important
information about the dimensionality, estimating not only
the conductivity but also the oscillator strength or spectral weight for transitions along principal directions.
These measurements are difficult for the c axis, because
crystals of this family have the habit to grow in thin plates
with minimum dimension along c while thin films tend
to grow with the c axis normal to the substrate surfaces.
Nevertheless, there have been several c-axis polarized
measurements reported. Room temperature measurements on Laz_xSrxCuO4 samples which were metallic [9]
and even superconducting [10] and on metallic LazNiO4
samples [ 11] find essentially insulating behavior along c.
In this context, "insulating behavior" means the absence
of electronic aborption in the far-infrared region, so that
the spectrum is dominated by features associated with
optical phonons. Tamasaku et al. [10] showed that below
Tc superconducting samples of Laz_xSrxCuO4 develop a
sharp plasma edge - a measure of the superfluid density.
Recent measurements of Bi2Sr2CaCu208 find highly insulating c-axis reflectance, both above and below T~ [12].
YBa2Cu307_ ~ is an important material for the study
of the c axis, on account of the variation in c axis transport that can be obtained, either by doping or by variation in the oxygen content & Several studies have reported metallic reflectance for e-axis polarization in
YBazCu307_ ~. Bozovic et al. [13] reported a stronglydamped plasma edge near 0.1 eV from reflectance mea-
314
surements of YBa2Cu307_ o crystals using an infrared
microscope. Kamba et al. [ 14] reported c-polarized spectra for films grown on (110) SrTiO 3 substrates; however,
this experiment was not completely successful on account
of imperfect orientation of the c axis. There are other
papers reporting on anisotropy in the near Jr-visible-near
uv regions [15-19].
In the far infrared region, Collins et al. [20] claimed
to measure the anisotropy of the superconducting gap on
a mosaic of about 12 crystals with polished surfaces. Perhaps the first reliable single crystal data were presented
by Koch et al. [21]. Above Tc an overdamped plasma
edge seems to appear in the c-axis spectrum while below
Tc a very sharp plasma-like reflectance edge occurs at
100 cm -1. Homes et al. [22] have measured reduced Tc
crystals of YBa2Cu307_ ~ (Tc~ 63 K). c-axis polarized
electronic absorption is seen in the far infrared for both
the normal and superconducting states. Below To, there
is a dramatic sharpening of a plasma-like edge at about
60 cm- 1 in the reflectance and evidence for a pseudogap
at about 200 cm-1 in the optical conductivity. Above Tc
the plasma edge is overdamped and the pseudogap absent.
The effect of oxygen variation on the c-axis spectra of
YBa2Cu307_ ~ has been measured by Dfirrler et al. [23]
and Cooper et al. [24, 25]. The data were taken at room
temperature. Both measurements show a strongly damped
electronic band for 0 ~ 0 whose strength decreased with
increasing 0. One thing to note is that at all values of
the c-axis spectra clearly show optical phonon features,
so the presence of phonon signatures are not by themselves evidence for "insulating" behavior; instead, one
looks for small (or zero) optical conductivity at frequencies between the phonon features or for near zero reflectance at the longitudinal-optical phonon minima in the
reflectance. (The latter indicates a small value of o-1(o))
at the longitudinal optical frequency.) By these criteria,
only the tetragonal YBa2Cu306 spectra of Dfirrler et al.
[23] can be said to be highly insulating.
In this paper we report the anisotropy of the far-infrared reflectance parallel to and perpendicular to the ab
plane of GdBa2Cu307_ a . Our samples are deficient in
oxygen content and inadvertently doped with A1, so that
the transition temperature is --~30K. This value puts it
at the low end of the range where superconductivity occurs in the RBa2Cu307_ a system. The crystal studied in
detail was unusually large, 5 • 2 1 5 1.5 mm 3, and had a
facet with excellent optical quality containing the c axis,
allowing polarized reflectance measurements to be made
without recourse to mosaics, polishing, or microscopes
with their steeply converging beams.
GdBa2Cu307_ ~ is isomorphic with YBa2Cu307 _ ~; the
only difference is the substitution of Gd for Y. As is well
known, this substitution has minimal effect on the physical properties, including superconductivity, with the exception that the unpaired electrons of the Gd 3+ ions give
a strong paramagnetic susceptibility and undergo a phase
transition at 2.2 K into an antiferromagnetic state.
H. Experimental details
The GdBa2Cu307_ o crystals were grown by spontaneous
crystallization from a high-temperature melt consisting
of 0.7% Gd203, 29% BaO, and 70% CuO. This Cu-rich
and Gd-poor mixture was heated in an alumina crucible
to 1060 C and held there for 5 h. The system was then
cooled at a rate of 10 degrees/day to 940 C. The remaining liquid was decanted while still in the oven, to avoid
thermal stress on the crystals. After that, the crystals
were cooled to room temperature at a rate of 10-20 degrees/h. Crystals obtained by this method ranged in size
up to a maximum of 5 • 4 • 1.5 mm 3. Elemental analysis
showed that the crystals had acquired a considerable
amount of A1 from the cruicible; the composition was
found to be GdBal 8CuzsA10.2507_ ~. Further details of
the growth of these crystals will be presented elsewhere
[26].
Several techniques were used to characterize our
samples. The dc electrical resistance shows two superconducting drops: one partial at 90 K and the second to
zero resistance at 30 K. The magnitude of the resistance
is quite high in comparison to high quality samples. The
optical measurements, discussed below, suggest that the
room-temperature resistivity is ,-~700 ~ - c m , compared
to ,-~200 ~tO-cm for fully oxygenated crystals or films of
YBazCu307 .
The magnetic susceptibility, which we also measured,
shows a small deviation from a paramagnetic 1/T dependence at 87 K. The oxygen content 0 was estimated
from the Raman spectrum [27, 28]. From this we concluded that the best description of our crystals would be
by the formula GdBazCu306. 4. This value means that in
the phase diagram they are located in the vicinity of the
metal/insulator transition but on the metallic side. (The
position of this transition is now considered to be at O6~35
[-29, 30].) The estimated oxygen content is consistent with
the lower transition in the resistivity, so we take Tc to be
30 K. Observation of the crystal surfaces under a polarizing microscope revealed ab microtwinning, which prevented us from distinguishing anisotropy in the ab plane.
This observation, however, demonstrates that the sample
had the orthorhombic crystal structure necessary for superconductivity in the RBazCu307 ~ system.
We made reflectance measurements on two faces of
the crystal, one which contained the ab plane and one
which contained the c axis, using a Bruker I F S l l 3 v
interferometric spectrometer
over
50-5000 cm- 1
(0.006-0.6 eV) and using Perkin-Elmer 16U spectrometer
over 1000-30 000 cm-1 (0.12-3.7 eV). For our measurements we used the natural crystal surface unmodified by
polishing or any other treatment. The reflectance was
measured relative to an A1 reference mirror and corrected
for the known reflectance of A1. After measurements, the
surface of our crystal was coated with A1 and the reflectance of the coated sample measured, in order to determine accurately the sample area and to estimate the diffuse scattering due to any imperfections in the surface.
A continuous-flow cryostat was used to cool the sample
to a base temperature of 20 K.
315
1.0
III. Results
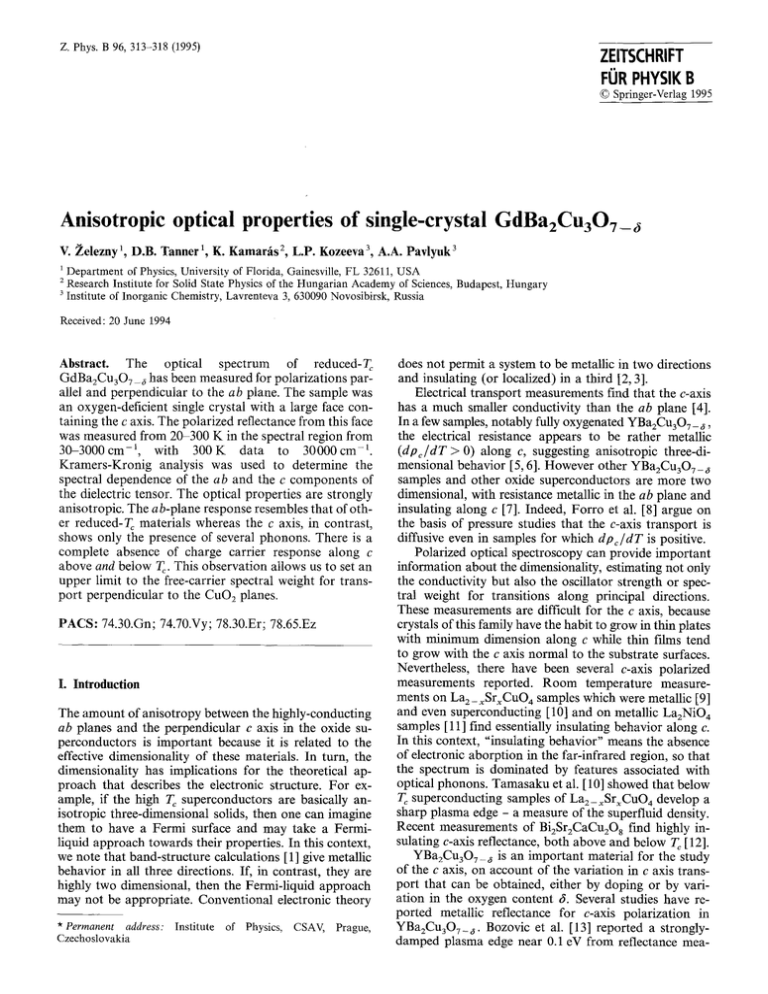
The reflectance from the facet containing the c-axis is
completely different for the two polarizations, as shown
in Figs. 1-3. Figure 1 shows the 300 K reflectance over
100-30 000 cm -1 (0.012-3.7eV) for both the ab-plane
and the c-axis directions. The ab-plane reflectance shows
a rapid decrease with increasing frequency. There is a
weak structure around 5000cm - t (0.6eV) and an-
I
I
I
I
I
20 K
50 K
100 K
0.8
150
200
250
300
......
0
0
K
K
K
K
0.6
O
.+(9
_.m
0.4
r'v"
Photon Energy (eV)
0
1
2
0.2
3
1.0
0.C
_
0.8
0
E
_
ab
c
o
N-Q)
O2 0.4
0.2
0.0
20000
10000
30000
(cm
Fig. 1. Polarized reflectance of GdBa2Cu307_ ~ at room temperature
1.0
o,
CK
50 K
100 K
150
0.7
......
0.6
~
200
-
-
~
K
200 K
250 K
300
P
400
K
I
600
~(~
I
800
I
400
I
600
~O(~ )
I
800
I
1000
1200
Fig. 3. The reflectance of GdBazCu307_ ~ for radiation polarized
along the c axis
plane
axis
0.6
0
I
200
I
1000
200
Fig. 2. The reflectance of GdBa2C%OT_ ~ for radiation polarized
along the ab plane
other around 12 000 cm -1 (1.5 eV). The data, including
these weak features, resemble closely the Tc=30K
YBa2Cu307_ 6 sample reported by Orenstein et al. [31].
The c-axis spectrum is quite flat. The low frequency structure is associated with optical phonons. In addition, there
are broad bands around 8000cm -1 and 16000cm -1
(1 and 2 eV, respectively) and a minimum at our upper
frequency limit. The data differ strongly from the c-axis
reflectance of the tetragonal phase (0>~0.8), which is
dominated by a strong feature at 3.8 eV [19]. In particular, Kircher et al. [19] show that there is a rising reflectance over 2-3.8 eV in the highly oxygen deficient
material whereas samples with small values of 5 have a
decreasing reflectance in this range. These comparisons
give us confidence in our characterization of the sample
as reduced To, superconducting GdBa2Cu307_ 6.
Figure 2 shows the ab-plane-polarized reflectance at
temperatures between 20 and 300 K. These spectra are
similar to those reported in many previous measurements
[31-33]. At the lowest temperatures, the reflectance is
close to unity below 150 cm-1. However, the characteristic shoulder or knee around 430 cm- 1that is commonly
seen in the E []ab spectrum does not occur in the spectra
of Fig. 2. Weak features at 150, 350, and 560cm -1 are
due to phonons, visible on account of the reduced carrier
concentration in this sample. As temperature is increased,
the reflectance drops, with the decrease largest at the
lowest frequencies.
In contrast to the electronic absorption which dominates the ab-plane optical properties, the reststrahlen
bands of optical phonons are the principal features of the
c-axis reflectance, shown in Fig. 3. This reflectance is
characteristic of a semiconductor or insulator, with quite
deep minima at the longitudinal optical frequencies. As
co--*0, the reflectance decreases and approaches a constant value ~ - - 0 . 4 . There is insignificant contribution
of free carriers to the spectrum. There is also no clear
evidence for appearance of the midinfrared absorption
well-known from ab-plane measurements. The tempera-
316
2000
ture dependence of the spectra is practically negligible;
there is only a small amount of sharpening of the phonons
at low temperatures. In particular, the spectra are the
same above and below the temperature where the material
is superconducting. The onset of superconductivity has no
effect on the e-axis spectrum in the 30-3000 cm-1 range.
20
100
300
o
1000
T
IV. Kramers-Kronig analysis
b
A. ab-plane results
see E
We used Kramers-Kronig analysis to determine the optical conductivity, o"1(co), and the real part of the dielectric function, e I (co), from our reflectance data. We
used different low-frequency extrapolations for the two
polarizations: for Ej]_qb we used a Hagen-Rubens
formula ~ = 1 - A ]/oJ above Tc. On account of the
,-~ 100% reflectance, below T~, the reflectance was extrapolated as ~ = 1 in this temperature range. For Ell c
we used a constant reflectance below the lowest measured
frequency [34]. At high frequencies a power law continuation was used.
The ab-plane dielectric function, shown in Fig. 4, is
negative at low frequencies, as expected for a conductor,
with a zero-crossing at 3700 cm-a in the near infrared.
At low temperatures, el(co) is well described by
el (co) = e~ -cop2/co2, as has been shown previously [34].
For our sample, we find cop~5700cm -~. A derivativelike structure from the ab-plane optical phonons can also
be seen superimposed on the electronic background.
The ab-plane optical conductivity, shown in Fig. 5, is
similar to those published earlier for superconducting
samples. Above T~ there is a low-frequency upturn due
to the response of the charge carriers, which is Drudelike at low frequencies and which has a non-Drude falloff in the midinfrared range. With decreasing temperature, the zero-frequency conductivity increases and the
width of the low frequency upturn narrows until T~ is
reached. Below To, the low-frequency conductivity is
r
K
K
K
1500
'E
100
I
I
i
0
I
0
I
200
,
I
400
'
F
600
~(Cm -1 )
'
I
r
800
I
'
1000
1200
Fig. 5. The ab-plane optical conductivity a I (co) of a crystal of
GdBa2Cu3OT_a
200
I
~
I
I
I
20
300
......
K
K
150
100
~-
50
S
0
-50
-100
I
200
I
400
I
600
~(Cm -1 )
I
800
,
I
1000
1200
Fig. 6. The dielectric function el(co ) for ERe of a crystal of
GdBazCu307_
sharply reduced as the charge carriers condense into the
superfluid. Several sharp ab-plane phonon modes can be
seen superimposed on the electronic background of Fig. 5.
The frequencies of these phonons are listed in Table 1.
I
-1 O0
B. c-axis results
-300
-500
-700
20
100
300
......
-900'
,
0
,,,
2OO
,
r
40~
,
~
60O
~(Om -I)
,
8OO
T
'
1000
K
K
K
,
1200
Fig. 4. The ab-plane dielectric function e 1(o~) of a crystal of
GdBa2CU3OT_~
For Ell c, the real dielectric function, shown in Fig. 6 for
our highest and lowest measurement temperatures, is
positive everywhere except in the phonon reststrahlen
bands, between transverse and longitudinal phonon frequencies. The low-frequency limiting value is el ( 0 ) = 21
while the midinfrared value is ~'opt ~-7. Most of the oscillator strength is in the lowest band at 148 cm-1. The
values for ~1 (0) and Copt are in good agreement with those
for other perovskites when the contributions of soft modes
are subtracted.
The phonons are essentially the only things that can
be seen in the c-axis-polarized optical conductivity, which
317
800
i
spectrum of Fig. 2. The difference between these spectra
and other ab-plane spectra may well be explained by the
effect discovered by Reedyk et al. [38]. The spectra differ
due to the direction of incidence of the light: along e in
most measurements but perpendicular to c in the one
reported here. This effect has been studied in some detail
by Reedyk et al. [38] in PbzSr2(Y/Ca)Cu309_ ~.
i
......
20 K
300 K
600
I
E
o
7
400
B. c-axis spectra
b
oo
0
'
200
400
600
~(cm-')
800
1000
1200
Fig. 7. The optical conductivity a~(m) for Ell c of a crystal of
GdBa2Cu307_
Table 1. Frequencies (in cm 1) of Phonon features in
GdBa2Cu307
Polarization
ab plane
e axis
150
148
176
227
288
333
320
420
493
547
560
680
620
Note." An additional c-axis-polarized band is seen at 800 cm -~,
above the maximum of the one-phonon frequencies
is shown in Fig. 7. The data are from 20 K and 300 K
reflectance measurements; there is only small temperature
dependence in this polarization. The phonon frequencies
are listed in Table 1. These phonons are grouped into
three doublets (some are seen as shoulders) and one
singlet. The frequencies are in good agreement with reports in the literature for the c-axis phonons [20,21] in
YBa2Cu30 7 and definitely different from those for the caxis phonons [35] in YBazCu306 . This result is further
confirmation that our sample is representative of superconducting material.
The spectrum also has a clear conductivity peak at
800 cm-1. This frequency is well above the highest phonon frequency in neutron density of states measurements
[36] and therefore cannot be assigned to a single-phonon
absorption. We suggest it is due to a two-phonon process
related to the known anomalies [37] in the phonon spectrum around 400 cm-1 (50 meV), although a magnetic
absorption cannot be ruled out.
V. Discussion
A. ab-plane spectra
The characteristic notch in the conductivity, well known
from ab-plane measurements [31-34], is very difficult to
see in Fig. 5. One reason is the presence of phonon structure in this spectral region. However, there is a direct
relation between the absence of the notch in the conductivity spectrum and the missing knee in the reflectance
Comparing our data to previous measurements of the c
axis, we find some similarity with the measurements of
Koch et al. [21] and Homes et al. [22]. These two measurements find nearly the same positions of the phonon
bands as occur in our spectra. We find less agreement
with the spectra of Collins et al. [20]. In the latter case,
the data look more like the unpolarized spectra of ceramic
samples, perhaps on account of the mosaic of several
small crystals used.
The key difference between the spectra presented here
and those of other groups [20-22, 24, 25] is the absence
of any contribution of free carriers to our e-axis conductivity. This difference must be due to the reduced Tc of
our crystals. The other samples that have been studied
had T c near 90 K [20, 21] and 63 K [22]. In our case, the
doping level was considerably lower (&~0.6) and
To= 30 K.
The absence of any free carrier contribution to our cpolarized spectra has interesting consequences. From a
two-component analysis of the ab-plane spectra, we find
that most of the free carriers condense into the superfluid,
with plasma frequency ~Opsob= 5700 cm-1. This leads to
an estimate of the ab-plane penetration depth of
Jlab = 2800 A. In contrast, the screened plasma frequency
for e, ~ psc = ~Op~c/~- must be at a frequency lower than
50 cm-1. Otherwise, we would see a plasma minimum
similar to what was reported by Tamasaku et al. [10] for
La2_xSrxCuO4. Taking e =21 we get oop~ob=<230cm- t
or a penetration depth of 2 r 7 p.
Assuming a one-electron band scheme and using a
three-dimensional tight-binding model, O~pcis given by
2 __
('DPc
e2
~2/7k
h2~O~l~If(~k)
ge0h2V sin
(1)
where f ( e ~ ) is the Fermi-Dirac occupation function, t c
is the transfer integral, c is the lattice constant along the
c axis, V is the unit cell volume, e0 is the dielectric constant of vacuum, and p is the site occupancy. Equation
(1) gives tc < 0.045 meV. This value is extremely low, corresponding to a temperature of 0.6 K. A three-dimensional model is therefore almost certainly not correct,
because with this small a value for tc, the Fermi surface
would be open in the direction of the c axis. With an
open Fermi surface, only a certain portion of the charge
carriers can contribute to intraband optical transitions
polarized E[[ c, so that t c is in fact larger than inferred
318
above. This effect was first pointed out by K w a k [39] in
the context of organic conductors. Using
ogp~ _ ~
Ct c
o)po~
aE '
(2)
where a is the lattice constant along the a axis and E,
defined by
2 _ 2e2a2E
~
h2V
(3)
is a function of band width and band filling. This analysis
gives tc__<0.75 meV, corresponding to a temperature of
9 K. Thus, down to ,-~9 K there is no correlation of electron motion along the c axis. Note that this temperature
is definitely below the superconducting transition temperature.
Our results show that the electronic properties of
oxygen deficient GdBazCu307_ a are strongly anisotropic. It behaves like a metal, albeit an unusual metal,
in the a b plane while along the c axis it looks like an
insulator. Because our sample is definitely superconducting, this result has clear implications for the electronic structure of the oxide superconductors. Superconductivity can occur in samples which have no coherent
transport along c. Note, however, that unlike expectations for two-dimensional models [40], - and in contrast
with the results for Laa_xSrxCuO4 [10] - our sample
shows no development of the plasma edge of the superfluid below T~. Thus, even well below T~, there is a strongly
two-dimensional flavor to its optical properties.
We would like to acknowledge enthusiastic discussions with
P.W. Anderson, P.B. Littlewood, J.R. Schrieffer, and T. Timusk.
Work at Florida is supported by NSF grants DMR-9101676 and
DMR-9403984. Research in Hungary supported by the Hungarian
National Foundation for Scientific Research under Grant No. 2950
and by the Hungarian-American Joint Fund grant 92b-271.
References
1. Pickett, W.E.: Rev. Mod. Phys. 61, 433 (1989)
2. Anderson, P.W.: Int. J. Mod. Phys. B4, 181 (1990)
3. Anderson, P.W. : Science 256, 1526 (1992)
4. For a review; see Cooper, S.L., Gray, K.E.: In: Physical
properties of high temperature superconductors III, p. 61.
Ginsberg, D.M. (ed.). Singapore: World Scientific 1994
5. lye, Y., Tamegai, T., Sakakibara, T., Goto, T., Miura, N.,
Takeya, H., Takei, H.: Physica C153-155, 26 (1988)
6. Friedmann, T.A., Rabin, W.M., Giapintzakis, J., Rice, J.P.,
Ginsberg, D.M.: Phys. Rev. B42, 6217 (1990)
7. Hagen, S., Jing, T.W., Wang, Z.Z., Horvath, J., Ong, N.P.:
Phys. Rev. B37, 7298 (1988)
8. Forro, L., Ilakovac, V., Cooper, J.R., Ayache, C., Henry,
J.-Y.: Phys. Rev. B46, 6626 (1992)
9. Collins, R.T., Schlesinger, Z., Chandrashekhar, G.V., Shafer,
M.W.: Phys. Rev. B39, 2251 (1989)
10. Tamasaku, K., Nakamura, Y., Uchida, S. : Phys. Rev. Lett. 69,
1455 (1992)
11. Bassat, J., Odier, P., Gervais, F.: Phys. Rev. B35, 7126 (1987)
12. Tajima, S., Gu, G.D., Miyamoto, S., Odagawa, A., Koshizuka,
N.: Phys. Rev. B48, 16164 (1993)
13. Bozovic, I., Char, K., Yoo, S.J.B., Kapitulnik, A., Beasley,
M.R., Geballe, T.H., Wang, Z.Z., Hagen, S., Ong, N.P., Aspnes,
D.E., Kelly, M.K.: Phys. Rev. B38, 5077 (1988)
14. Kamba, S., Petzelt, J., ~elezn3~, V., Pechen, E.V.,
Krasnosvobodtsev, S.I., Gorshunov, B.P. : Solid State Commun.
70, 547 (1989)
15. Petrov, M.P., Grachev, A.I., Krasin'kova, M.V., Nechitailov,
A.A., Prokofiev, V.V., Poborchy, V.V., Shagin, S.I., Kartenko,
N.F.: Solid State Commun. 67, 1197 (1988)
16. Maksimov, E.G., Rashkeev, S.N., Savrasov, S.Y., Uspenskii,
Y.A.: Plays. Rev. Lett. 63, 1880 (1989)
17. Kircher, J., Alouani, M., Garriga, M., Murugaraj, P., Maier,
J., Thompson, C., Cardona, M., Andersen, O.K., Jepsen, O.:
Phys. Rev. B44, 217 (1991)
18. Geserich, H.P., Koch, B., Diirrler, M., Wolf, Th.: In: Electronic
properties of high T~ superconductors and related compounds.
Kuzmany, H., Mehring, M., Fink, J. (eds.). Springer Series in
Solid State Science, Vol. 99, p. 265. Berlin, Heidelberg,
New York: Springer 1990
19. Kircher, J., Kelly, M.K., Rashkeev, S., Alouani, M., Fuchs, D.,
Cardona, M.: Phys. Rev. B44, 217 (1991)
20. Collins, R.T., Schlesinger, Z., Holtzberg, F., Feild, C. : Phys.
Rev. Lett. 63, 422 (1989)
21. Koch, B., Diirrler, M., Geserich, H.P., Wolf, Th., Roth, G.,
Zachmann, G.: In: Electronic properties of high-Tc superconductors and related compounds. Kuzmany, H., Mehring,
M., Fink, J. (eds.). Springer Series in Solid State Sciences,
Vol. 99, p. 290. Berlin, Heidelberg, New York: Springer 1990
22. Homes, C.C., Timusk, T., Liang, R., Bonn, D.A., Hardy, W.N.:
Phys. Rev. Lett. 71, 1645 (1993)
23. Dfirrler, M., Zibold, A., Wider, K., Geserich, H.P., Wolf, Th.,
Roth, G., Brfiuchle, G., Erb, A., Miiller-Vogt, G., Kircher, J.:
In: Electronic properties of high- Tc superconductors. Kuzmany,
H., Mehring, M., Fink, J. (eds.). Springer Series in Solid State
Science, Vol. l13, p. 265. Berlin, Heidelberg, NewYork:
Springer 1993
24. Cooper, S.L., Nyhus, P., Reznik, D., Klein, M.V., Lee, W.C.,
Ginsberg, D.M., Veal, B., Paulikas, A.P., Dabrowski, B.: Phys.
Rev. Lett. 70, 1533 (1993)
25. Cooper, S.L., Reznik, D., Kotz, A., Karlow, M.A., Liu, R.,
Klein, M.V., Lee, W.C., Giapintzakis, J., Ginsberg, D.M., Veal,
B., Paulikas, A.P. : Phys. Rev. B47, 8233 (1993)
26. Kozeeva, L.P., Pavlyuk, A.A.: (tmpublished)
27. Burns, G., Dacol, F.H., Field, C., Holtzberg, F.: Solid State
Commun. 77, 367 (1991)
28. Zelezn3~, V., Tanner, D.B., Park, C., Anderson, T.J., Kozeeva,
L.P., Pavlyuk, A.A.: Phys. Status Solidi b 177, K37 (1993)
29. Jorgensen, J.D., Veal, B.W., Paulikas, A.P., Nowicki, L.J.,
Crabtree, G.W., Claus, H., Kwok, W.K.: Phys. Rev. B41, 1863
(1990)
30. Cava, RJ., Hewat, A.W., Hewat, E.A., Batlogg, B., Marezio,
M., Rabe, K.M., Krajewski, J.J., Peck, Jr. W.F., Rupp, Jr.
L.W.: Physica C165, 419 (1990)
31. Orenstein, J., Thomas, G.A., Millis, A.J., Cooper, S.L., Rapkine,
D.H., Timusk, T., Schneemeyer, L.F., Waszczak, J.V. : Phys.
Rev. B42, 6342 (1990)
32. Timusk, T., Tanner, D.B.: In: Physical properties of high
temperature superconductors I, p. 339. Ginsberg, D.M. (ed.).
Singapore:World Scientific 1989
33. Tanner, D.B., Timusk, T.: In: Physical properties of high
temperature superconductors III, p. 363. Ginsberg, D.M. (ed.).
Singapore:World Scientific 1992
34. Kamar/ts, K., Herr, S.L., Porter, C.D., Tache, N., Tanner, D.B.,
Etemad, S., Venkatesan, T., Chase, E., Inam, A., Wu, X.D.,
Hegde, M.S., Dutta, B.: Phys. Rcv. Lett. 64, 84 (1990)
35. Crawford, M.K., Burns, G., Holtzber, F. : Solid State Commun.
70, 557 (1989)
36. Renker, B., Gompf, F., Gering, E., Ewert, D., Rietschek, H.,
Dianoux, A.: Z. Phys. B73, 309 (1988)
37. Reichard, W., Pyka, N., Pintschovius, L., Hennion, B., Collin,
G.: Physica C162-164, 464 (1989)
38. Reedyk, M., Timusk, T.: Phys. Rev. Lett. 69, 2705 (1992)
39. Kwak, J.F.: Phys. Rev. B26, 4789 (1982)
40. Anderson, P.W.: Physica C185-189, 11 (1991)
