Video Analytics: when and how do students use tutorial videos?
advertisement

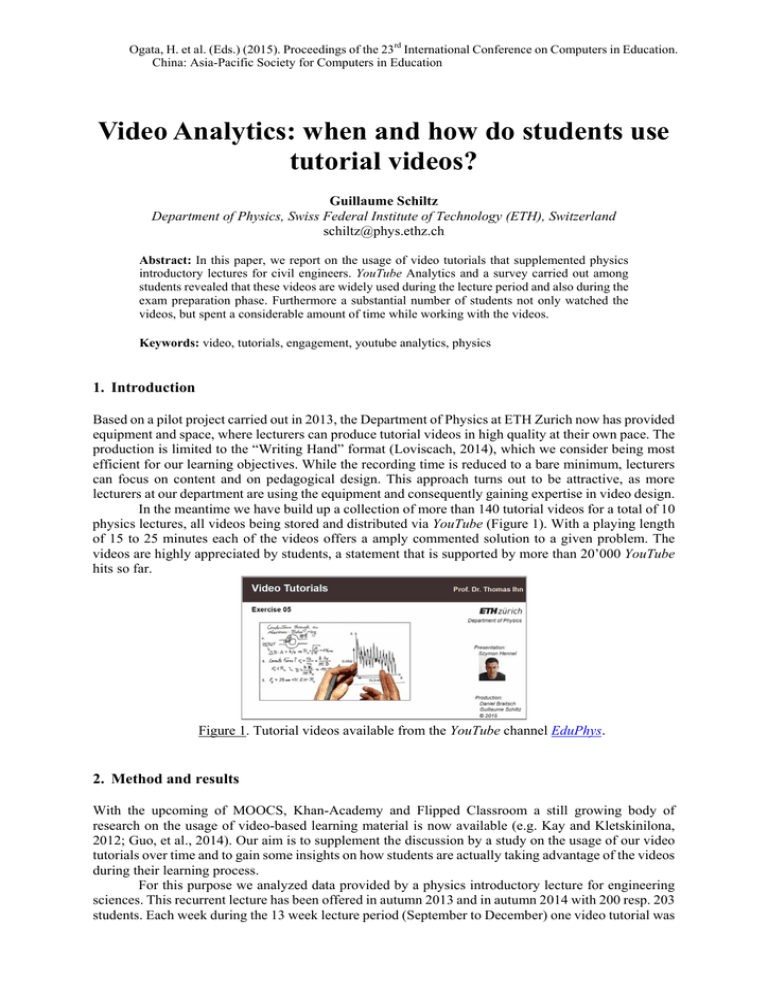
Ogata, H. et al. (Eds.) (2015). Proceedings of the 23rd International Conference on Computers in Education. China: Asia-Pacific Society for Computers in Education Video Analytics: when and how do students use tutorial videos? Guillaume Schiltz Department of Physics, Swiss Federal Institute of Technology (ETH), Switzerland schiltz@phys.ethz.ch Abstract: In this paper, we report on the usage of video tutorials that supplemented physics introductory lectures for civil engineers. YouTube Analytics and a survey carried out among students revealed that these videos are widely used during the lecture period and also during the exam preparation phase. Furthermore a substantial number of students not only watched the videos, but spent a considerable amount of time while working with the videos. Keywords: video, tutorials, engagement, youtube analytics, physics 1. Introduction Based on a pilot project carried out in 2013, the Department of Physics at ETH Zurich now has provided equipment and space, where lecturers can produce tutorial videos in high quality at their own pace. The production is limited to the “Writing Hand” format (Loviscach, 2014), which we consider being most efficient for our learning objectives. While the recording time is reduced to a bare minimum, lecturers can focus on content and on pedagogical design. This approach turns out to be attractive, as more lecturers at our department are using the equipment and consequently gaining expertise in video design. In the meantime we have build up a collection of more than 140 tutorial videos for a total of 10 physics lectures, all videos being stored and distributed via YouTube (Figure 1). With a playing length of 15 to 25 minutes each of the videos offers a amply commented solution to a given problem. The videos are highly appreciated by students, a statement that is supported by more than 20’000 YouTube hits so far. Figure 1. Tutorial videos available from the YouTube channel EduPhys. 2. Method and results With the upcoming of MOOCS, Khan-Academy and Flipped Classroom a still growing body of research on the usage of video-based learning material is now available (e.g. Kay and Kletskinilona, 2012; Guo, et al., 2014). Our aim is to supplement the discussion by a study on the usage of our video tutorials over time and to gain some insights on how students are actually taking advantage of the videos during their learning process. For this purpose we analyzed data provided by a physics introductory lecture for engineering sciences. This recurrent lecture has been offered in autumn 2013 and in autumn 2014 with 200 resp. 203 students. Each week during the 13 week lecture period (September to December) one video tutorial was provided to the students as an optional learning aid for the topics covered during this week. For each lecture we offered a different set of videos, i.e. a total of 26 (2x13) video tutorials has been used for this study. The assessment for each lecture course is restricted to a final exam taking place at the end of January. A limited number of students take advantage of a supplementary re-test, which is offered in August. Usually the exam consists of problems comparable to those that are covered by the tutorial videos. In this setting, students had no obligation to use the videos and they were free to decide, when and how to make usage of them. For our study we consider data coming from two different sources: Data provided by YouTube analytics (YouTube Analytics Metrics, 2015) on the number of times that a video has been viewed and on the average percentage of a video watched during a video playback (Figure 2). Data provided by a questionnaire that we asked students to fill-in at the end of the second lecture period in December 2014. The questionnaire included 9 questions. From a total of 203 students 93 students participated in this survey (Figure 3). Monthly views and average percentage of video watched 1400 100% 90% 1200 Views (lecture period) 80% views 70% 800 60% 600 50% 40% 400 percentage viewed 1000 30% 200 20% 0 Views (exam period) Views (re‐test period) Views (no lecture) Average percentage viewed (video duration) 10% Feb 15 Jan 15 Dec 14 Nov 14 Sep 14 Oct 14 Aug 14 Jul 14 Jun 14 Apr 14 May 14 Mar 14 Feb 14 Jan 14 Dec 13 Oct 13 Nov 13 Sep 13 data according to youtube analytics Figure 2. Youtube: monthly views and average percentage of video watched. Figure 3. Survey results: video usage. 3. Discussion More than half of the students have been extensively watching the videos during the lecture periods (400-600 monthly views). Almost all of those students, not having used the videos, claimed that they were lacking time for this task. A great fraction, however, stated that they will surely use the videos for their exam preparation. The high peaks of views during the preparation period confirm this intend. Among those students that watched the videos during the lecture period, 24% have been spending much more time on each video than its actual playing length, 81% reported that they have been using additional material (script, notes, etc.) while watching the videos. 31% of all students strongly agreed that the videos supported them in understanding the subject. Interestingly enough, only 4 students claimed that they cannot learn with videos. To a great extend, students have been using the video tutorials, even though there was no obligation to do so. According to figure 1 the weekly submitted video tutorials were viewed evenly during both lecture periods. The lower number in September results from the fact that the term starts in mid-September and the first tutorial was available only at the end of the month. High peeks during the exam period show evidence that students extensively used the videos for preparation. The average length of each video watched varies from 2013 to 2014. This might result in the different video sets used in both lecture courses. However, the video chunks watched during a playback still show high proportions, around 50% in 2013 and around 35% in 2014. According to YouTube these values reflect a high degree of engagement. The low rate during the re-test period may result from the fact, that the re-test took place in early August 2013. Only few students sat this exam, which results in low views during the summer. With an average video length of 15-25 minutes, students have watched a substantial chunk of video during each playback, which again gives evidence that they have been working with the videos and not only consuming them. 4. Conclusions Three major conclusions may be drawn from our study: Most students used the video tutorials in a way to support their understanding by showing high engagement. Compared to former lectures without video tutorials, however, we could not find any significant improvement in the exam grades. The impact of different cohorts might be too strong. Students used the tutorials during the lecture period in the process of knowledge acquisition and during the exam preparation for knowledge consolidation. It is important to keep both usage modes in mind when designing educational videos. Even though YouTube Analytics is primarily focusing on merchandising needs, it also provides suitable metrics to perform learning analytics. To sum up, videos showing detailed solutions to physics problems are highly appreciated by students, especially by engineering students who do not primarily have an interest in a comprehensive theoretical background. By now we have started to produce similar tutorials for our graduate physics students, where we focus on the application of theoretical concepts in different contexts. Preliminary student feedback on the usage of these videos suggests comparable results to our study. Acknowledgements We would like to thank Prof. Dr. Leonardo Degiorgi for his kind support and for giving us the opportunity to use the data related to his lecture courses. References Guo, P. J., Kim J., & Rubin, R. (2014). How video production affects student engagement: an empirical study of MOOC videos. Proceedings of the first ACM conference on Learning @ scale conference (L@S '14) (pp. 41-50). New York, NY: ACM. Kay R., & Kletskin, I. (2012). Evaluating the use of problem-based video podcasts to teach mathematics in higher education. Computers & Education, 59(2), 619-627. Loviscach, J. (2014) Friendly Handmade Explanation Videos. Proceedings of EMOOCs 2014 (pp. 240-244). [http://www.emoocs2014.eu/sites/default/files/Proceedings-Moocs-Summit-2014.pdf, visited on May 10, 2015] YouTube Analytics Metrics (2015). [https://developers.google.com/youtube/analytics/v1/dimsmets/mets, visited on May 10, 2015]

