1. Connecting Hardware – National Instruments
http://www.ni.com/academic/students/learnlabview/hardware.htm
Improve your ni.com experience. Login or Create a user profile.
1. Connecting Hardware
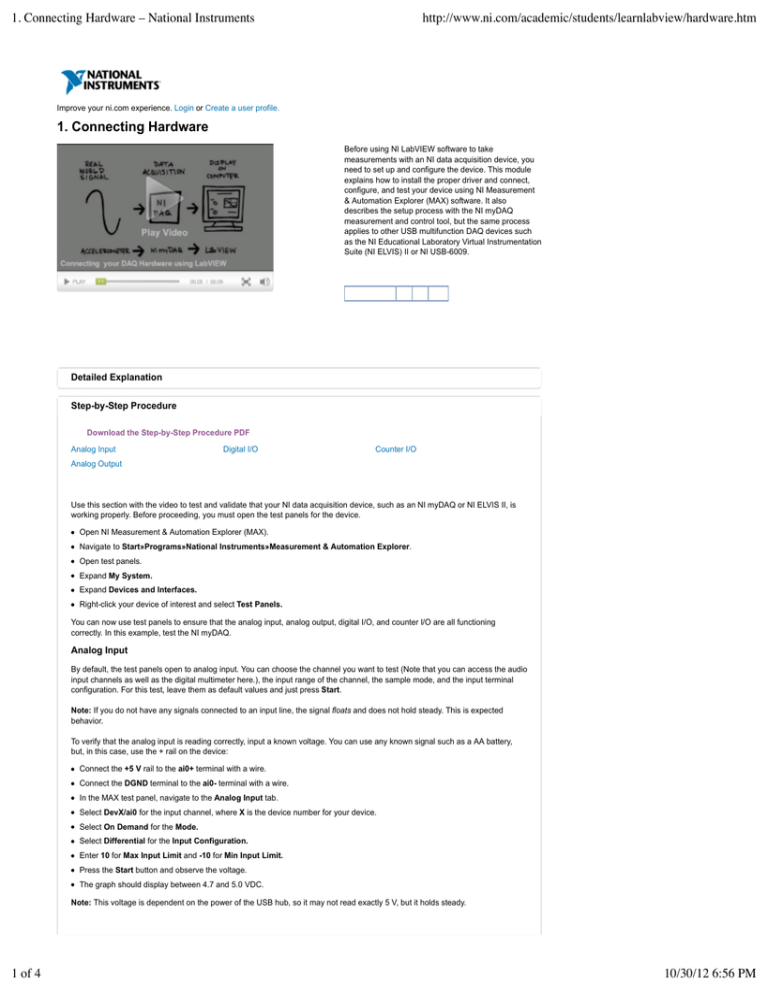
Before using NI LabVIEW software to take
measurements with an NI data acquisition device, you
need to set up and configure the device. This module
explains how to install the proper driver and connect,
configure, and test your device using NI Measurement
& Automation Explorer (MAX) software. It also
describes the setup process with the NI myDAQ
measurement and control tool, but the same process
applies to other USB multifunction DAQ devices such
as the NI Educational Laboratory Virtual Instrumentation
Suite (NI ELVIS) II or NI USB-6009.
Detailed Explanation
Step-by-Step Procedure
Download the Step-by-Step Procedure PDF
Analog Input
Digital I/O
Counter I/O
Analog Output
Use this section with the video to test and validate that your NI data acquisition device, such as an NI myDAQ or NI ELVIS II, is
working properly. Before proceeding, you must open the test panels for the device.
Open NI Measurement & Automation Explorer (MAX).
Navigate to Start»Programs»National Instruments»Measurement & Automation Explorer.
Open test panels.
Expand My System.
Expand Devices and Interfaces.
Right-click your device of interest and select Test Panels.
You can now use test panels to ensure that the analog input, analog output, digital I/O, and counter I/O are all functioning
correctly. In this example, test the NI myDAQ.
Analog Input
By default, the test panels open to analog input. You can choose the channel you want to test (Note that you can access the audio
input channels as well as the digital multimeter here.), the input range of the channel, the sample mode, and the input terminal
configuration. For this test, leave them as default values and just press Start.
Note: If you do not have any signals connected to an input line, the signal floats and does not hold steady. This is expected
behavior.
To verify that the analog input is reading correctly, input a known voltage. You can use any known signal such as a AA battery,
but, in this case, use the + rail on the device:
Connect the +5 V rail to the ai0+ terminal with a wire.
Connect the DGND terminal to the ai0- terminal with a wire.
In the MAX test panel, navigate to the Analog Input tab.
Select DevX/ai0 for the input channel, where X is the device number for your device.
Select On Demand for the Mode.
Select Differential for the Input Configuration.
Enter 10 for Max Input Limit and -10 for Min Input Limit.
Press the Start button and observe the voltage.
The graph should display between 4.7 and 5.0 VDC.
Note: This voltage is dependent on the power of the USB hub, so it may not read exactly 5 V, but it holds steady.
1 of 4
10/30/12 6:56 PM
Figure 13. Analog Input Wiring
Back to top | Collapse
Analog Output
Testing the analog output requires looping the analog output back to the analog input to verify the voltage. Start by configuring the
physical device.
NOTE: If you have not verified the analog input, do that now and then return to this section.
Connect ao0 to the ai0+ terminal with a wire.
Connect AGND to the ai0- terminal with a wire.
Navigate to the Analog Output tab in the MAX test panels.
Select DevX/ao0 for the input channel, where X is the device number for your device.
Select Sinewave Generation for the Mode.
Select <Default> for the Transfer Mechanism.
Enter 10 for Max Output Limit and -10 for Min Output Limit.
Enter 1k or 1000 for rate (Hz).
Enter 5 for Sinewave Amplitude.
Press the Start button to begin outputting the sine wave.
Now use the analog input to verify the analog output. Configure the analog input according to the analog input section. After
pressing Run, you can see a sine wave on the graph indicator with a 5 V amplitude, 10 Vpk-pk.
Figure 14. Analog Output Wiring
Back to top | Collapse
Digital I/O
To test the digital I/O, connect DIO0 to DIO4, DIO1 to DIO5, DIO2 to DIO6, and DIO3 to DIO7, with a wire for each pair, which
equals four wires total (see Figure 15). After connecting the wires, navigate back to the test panels in MAX.
Navigate to the Digital I/O tab in the MAX test panels.
Select DevX/ctr0 for the input channel, where X is the device number for your device.
Select Port0 for the Port Name.
Select Port0/line0:7 for the Port/Line Direction.
Toggle lines 0-3 to be input and lines 4-7 to be output.
Press the Start button.
Toggle the software switches for lines 0-3 to observe the software LEDs change for lines 4-7.
Figure 15. Digital I/O Wiring
Back to top | Collapse
2 of 4
10/30/12 6:56
Counter I/O
A counter can both input and output a digital signal deterministically. First, test the input by applying a 5 V to 0 V pulse train; the
counter can detect a transition from high to low or low to high.
NOTE: If you do not have a single-pole double-throw (SPDT) switch, you can simply connect a wire into PFI3 and then connect
and disconnect the other end of the wire to the +5 V terminal.
Connect a 330 ! resistor, SPDT switch in series to terminal DIO 3 as seen in Figure 16.
Connect one pole of the SPDT switch to the DGND terminal and the other pole to the +5 V terminal.
Navigate to the Counter I/O tab in the MAX test panels.
Select DevX/ctr0 for the input channel, where X is the device number for your device.
Select Edge Counting for the Mode.
Select /DevX/PFI3 for the Edge Source.
Press the Start button and toggle the SPDT switch to begin counting edges.
NOTE: If there is any noise on the signal, multiple edges may be counted for each transition of the SPDT switch.
Figure 16. Counter Input Wiring
Now test the output of the counter pulse train, which is a series of digital high and low pulses often used to trigger an event such
as a sample clock for data acquisition. To output a pulse train, you must
Connect a 330 ! resistor and an LED in series between terminal DIO 3 and the +5 V terminal as seen in Figure 17.
Navigate to the Counter I/O tab in the MAX test panels.
Select DevX/ctr0 for the input channel, where X is the device number for your device.
Select Pulse Train Generation for the Mode.
/DevX/PFI3 is the only option for the Pulse Terminal.
Enter 1 for the Frequency.
This outputs a high and low pulse every 1 second or 1 Hz.
Press the Start button to observe the LED blink at a rate of 1 Hz.
Figure 17. Counter Output Wiring
Back to top | Collapse
Module Quiz: Connecting Hardware
Take the short quiz below to evaluate your understanding of the concepts taught in the Connecting Hardware video and detailed
explanation.
1. __________ performs a basic functionality test of the device to see if it is communicating with the driver correctly.
Test Panels
Device Pinouts
Reset Device
3 of 4
10/30/12 6:56
Self-Test
2. __________ clears all associated tasks and references to the DAQ device.
Test Panels
Device Pinouts
Reset Device
Self-Test
3. __________ provide a low-level testing environment to verify that all input and output is working as expected.
Test Panels
Device Pinouts
Reset Device
Self-Test
4. __________ show all of the pin and terminal assignments for your DAQ device.
Test Panels
Device Pinouts
Reset Device
Self-Test
Cumulative Exam:
LabVIEW and DAQ
Cumulative Project:
LabVIEW and DAQ
Evaluate your understanding of LabVIEW
and the basics of DAQ. This exam is
recommended after you complete all of the
modules for LabVIEW Basic Concepts and
LabVIEW Basic Tasks. There are 26 multiple
choice questions on the exam.
Assess your working knowledge of building a
complete system by acquiring, processing,
and displaying data with LabVIEW and a
DAQ device. This project is recommended
after you complete all of the modules for
LabVIEW Basic Concepts and LabVIEW
Basic Tasks.
Take the exam
Start the project
What Do You Want to Learn Next?
1. Connect to Hardware
3. Analyze
Signal Processing Analysis
2. Acquire and Generate Data
Taking a Measurement
Monitoring and Alarming
Integrating Text-Based Programming
Generating a Signal
Using Counters and Digital I/O
4. Present and Log Data
Implementing Closed-Loop Control
Adding Data Logging
Triggering Data Acquisition
Building a User Interface
Using Graphs and Charts
My Profile | RSS | Privacy | Legal | Contact NI
© 2012 National Instruments Corporation. All rights reserved.
|
E-Mail this Page
4 of 4
10/30/12 6:56

