Linear Relationships
advertisement

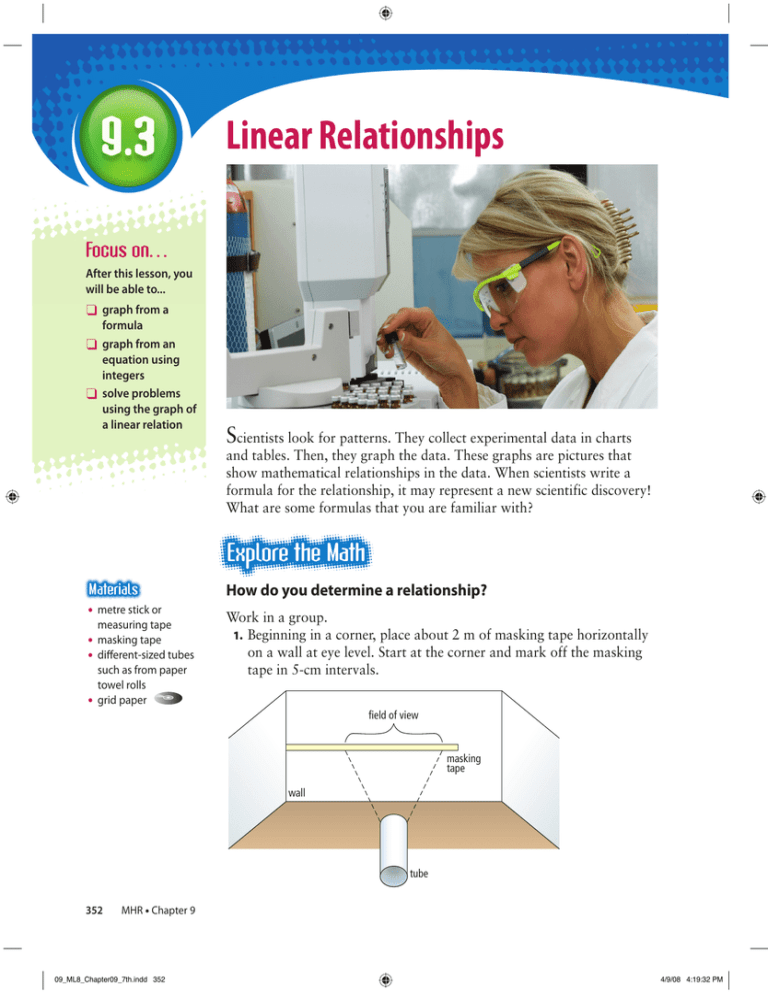
Linear Relationships Focus on… After this lesson, you will be able to... φ graph from a φ φ formula graph from an equation using integers solve problems using the graph of a linear relation Scientists look for patterns. They collect experimental data in charts and tables. Then, they graph the data. These graphs are pictures that show mathematical relationships in the data. When scientists write a formula for the relationship, it may represent a new scientific discovery! What are some formulas that you are familiar with? How do you determine a relationship? • metre stick or measuring tape • masking tape • different-sized tubes such as from paper towel rolls • grid paper Work in a group. 1. Beginning in a corner, place about 2 m of masking tape horizontally on a wall at eye level. Start at the corner and mark off the masking tape in 5-cm intervals. field of view masking tape wall tube 352 MHR • Chapter 9 09_ML8_Chapter09_7th.indd 352 4/9/08 4:19:32 PM 2. On the floor, measure and mark five distances from the wall. Start at 100 cm and increase the distance by 30 cm each time. 3. Copy the table into your notebook. Distance From Wall (cm) Width of Field of View (cm) 4. Predict how the width of your field of view through a tube will change as your distance from the wall increases. 5. For each distance from the wall, measure the width that you can see through the tube. Record the data in the table. 6. Write the results of your experiment as a set of ordered pairs. Graph the ordered pairs. 7. Compare your results with your prediction. 8. Repeat steps 3 to 7, using a different-sized tube. Reflect on Your Findings Do your data show a linear relation? Explain. b) Why might the points on your graph line up as they do? 9. a) Example 1: Graph From a Linear Formula Sound travels 1500 m/s in salt water. This relationship can be expressed by the formula d = 1500t, where d is the distance travelled, in metres, and t is the time, in seconds. a) Make a table of values. Use integers only. b) Graph the ordered pairs in your table of values. c) Is it reasonable to have points between the ones on this graph? Explain. d) Calculate the distance sound travels in 3.5 s. Literacy Link A formula is a mathematical statement that represents the relationship between specific quantities. An example is C = π × d, where C is the circumference and d is the diameter of the circle. 9.3 Linear Relationships • MHR 09_ML8_Chapter09_7th.indd 353 353 4/9/08 4:19:34 PM Solution a) Choose the numbers to use in the table of values. For example, t = 0, 1, 2, 3, 4, 5, 6 Time, t (s) 0 Distance, d (m) 0 1 d Speed of Sound in Salt Water 10 Distance (m) (thousands) 3 4 5 6 1500 3000 4500 6000 7500 9000 To determine d, substitute each t value into the formula. For example, substitute t = 3. d = 1500t d = 1500(3) d = 4500 b) 2 8 Choose at least four values for t in the table of values. Check that they are reasonable. It is not possible for t to be a negative integer since time cannot be negative. Check that t = 0 is reasonable in the context. When you are graphing, it is often useful to include zero as a value on the horizontal axis. 6 4 2 0 1 2 3 4 5 6 t Time (s) When you rent a tool or machine, you are charged by the hour. For example, if you rent a backhoe and 1 use it for 6 __ h, you are 2 charged for 7 h. 354 c) It is reasonable to have points between the ones on the graph. For example, it is possible to determine the distance at 2.5 s, and it is possible to determine the time at 4800 m. d) Substitute 3.5 for t in the formula d = 1500t. d = 1500(3.5) d = 5250 The distance travelled at 3.5 s is 5250 m. The estimate of 5000 m is close to the calculated distance of 5250 m. Paula rents a lawnmower for $8 per hour. A formula representing this relationship is C = 8t, where C is the rental cost, in dollars, and t is the time, in hours. a) Make a table of values. b) Graph the ordered pairs in your table of values. c) Is it reasonable to have points between those on the graph? Explain. d) Calculate the cost to rent for 12 h. MHR • Chapter 9 09_ML8_Chapter09_7th.indd 354 4/9/08 4:19:34 PM Example 2: Graph From a Linear Equation Using Integers Use the linear equation y = −3x + 4 to complete the following steps. a) Make a table of values. Use positive and negative integers and zero for values of x. b) Graph the ordered pairs in your table of values. c) Determine the value for y in the ordered pair (11, y). Solution a) Choose the numbers to use in the table of values. For example, x = -1, 0, 1, 2, 3, 4 b) x -1 0 1 2 3 4 y 7 4 1 -2 -5 -8 y 8 Since no context is given, many values for x and y are possible. Choose values for x that are the same distance apart. For example, you could choose x = -1, 0, 1, 2, 3, 4 or x = -2, 0, 2, 4, 6, 8. Literacy Link An equation is a mathematical statement with two expressions that have the same value. The two expressions are separated by an equal sign. For example, x+2=3 y - 7 = -4 3a - 2 = a + 2 b=4 6 4 2 –1 0 –2 1 2 3 4 x –4 –6 –8 c) Substitute x = 11 into the equation y = -3x + 4. y = -3x + 4 y = -3(11) + 4 y = -33 + 4 y = -29 Strategies Solve an Equation The value of the y-coordinate is -29. The ordered pair is (11, -29). Use y = 2x + 3 to answer the following. a) Make a table of values. Use integers only. b) Graph the ordered pairs in your table of values. c) What are the coordinates for the point that would lie on the y-axis? What is the value for x of a point that lies on the y-axis? 9.3 Linear Relationships • MHR 09_ML8_Chapter09_7th.indd 355 355 4/9/08 4:19:35 PM • You can graph a linear relation represented by a formula or an equation. First, make a table of values. Check that the values in the table are reasonable. Then, graph using the ordered pairs in the table. t = 3h - 2 t h t 0 -2 1 1 5 2 4 4 3 7 3 7 6 • Whenever possible, choose variables that are meaningful. For example, h for height and t for temperature. 2 1 0 –1 1 2 3 4 h –2 What do you notice about the coordinates for points on the x-axis? b) What do you notice about the coordinates for points on the y-axis? 1. a) 2. The equation y = 2x - 1 represents a linear relation. A table of values for y = 2x - 1 has been started below. Show two different ways to find the value of the missing y-coordinate. x 0 1 2 3 y -1 1 3 5 4 When you choose values for a table of values, what considerations might influence your choice? b) Why is it often useful to use zero as one of your x-values? 3. a) Give an example of a linear relation found in real life. Then, give an example of a linear relation without a context. b) Make a table of values for each linear relation. Use integers only. c) Graph each set of ordered pairs. d) How are these graphs similar? How are they different? 4. a) 356 MHR • Chapter 9 09_ML8_Chapter09_7th.indd 356 4/9/08 4:19:36 PM For help with #7 to #12, refer to Example 2 on page 355. For help with #5 and #6, refer to Example 1 on pages 353–354. 5. 7. Evaluate each equation using the given value. a) y = 5x - 3 when x = 6 b) y = x - 8 when x = 5 c) y = -5x when x = -2 d) y = x when y = 25 8. Evaluate y = 7x + 3 using each value. a) x = 1 b) x = -4 c) x = 0 d) y = 17 9. Make a table of values for each equation using x = -2, 0, 2, 4. Draw each graph. a) y = 3x + 2 b) y = x - 5 c) y = -4x d) y = 7 - x 10. Make a table of values for each equation. Choose at least four integer values for x. Graph each set of ordered pairs. a) y = 2x b) y = 3x - 1 c) y = -4x + 5 d) y = 5 - x 11. The graph below represents part of the linear relation y = -2x. A long-distance telephone plan can be represented as C = 6t, where C is the cost in cents and t is the time in minutes. 1 2 3 4 5 6 7 8 9 * 0 # Only 6¢ per minute anytime for calls across Canada! CallCanada Make a table of values, using at least four whole number values for t. b) Graph the ordered pairs. c) If part minutes are rounded up to the next whole minute, is it reasonable to have points between the ones on your graph? Explain. a) 6. An animal shelter hires you to walk dogs for $5 per dog. The relationship between the money you make and the number of dogs you walk can be expressed as W =5d, where W is the wage you make, in dollars, and d is the number of dogs you walk. y 4 3 2 1 –3 –2 –1 0 –1 1 2 3 x –2 –3 –4 Make a table of values. b) Graph the ordered pairs. c) Is it reasonable to have points between the ones on your graph? Explain. a) Use the equation to calculate the y-coordinate when x = -1. b) What is the value of y in (-4, y)? a) 9.3 Linear Relationships • MHR 09_ML8_Chapter09_7th.indd 357 357 4/9/08 4:19:36 PM 12. The graph represents part of the linear x. relation y = __ 3 15. In a bulk food store, rice crackers sell for 80¢ per 100 g. a) Copy and complete the table of values. y Mass of Purchase (g) 3 –6 –5 –4 –3 –2 2 0 1 100 –1 0 –1 1 2 3 4 5 200 6 x 300 –2 If you continue the table, what is the next most logical value to use for Mass of Purchase? Explain, using your knowledge of linear relations and patterns. c) Graph the ordered pairs. b) –3 What are the coordinates for the point that lies on the y-axis? b) Use the equation to calculate the y-coordinate when x = -3. c) For the point (-9, y), what is the value of y? a) b) 14. Graph the ordered pairs in the table. x y –2 0 1 2 4 4 7 6 16. e Is it reasonable to assume there are points between the ones on your graph if you have no other information? Why? You are given part of the table of values for a linear relation. x -3 -2 y -1 0 1 2 6 8 10 Nigel’s Monthly Earnings 1600 1500 1400 1300 1200 0 How could you use a pattern to find the missing y-coordinates? b) Identify the missing y-coordinates. a) 358 The graph shows Nigel’s monthly earnings. Monthly Earnings ($) 13. a) Cost (¢) 1 2 3 4 5 Sales ($) (thousands) 6 7 s If Nigel does not make any sales, what are his monthly earnings? b) Nigel has sales of $4000 in one month. How much does he earn? c) Nigel earns $1500 in a month. What are his sales? a) MHR • Chapter 9 09_ML8_Chapter09_7th.indd 358 4/9/08 4:19:38 PM 17. 18. You can buy work gloves from The Fix-It Store’s web site according to the formula C = 5g + 2, where C is the cost in dollars and g is the number of pairs of gloves. a) Make a table to show the number of pairs of gloves purchased in relation to the total cost. Use five values for g. b) Graph the ordered pairs. c) Does the relation appear linear? Why? d) Are there other points possible between the ones on the graph? Explain. e) What might 2 represent in the formula? George is a carpenter. He has a rewards card for the hardware store he uses. He receives 40 points for every $1 he spends. He can use the points to get savings on future purchases. a) Copy and complete the table showing the dollar amount spent in relation to the number of points received. Amount Spent ($) Points Received 1 40 19. Mass (g) How many points does George receive for spending $100? c) George can get a hammer for 100 000 points. How much money does he have to spend to get the hammer? b) 100 000 points 9 10 11 12 88 99 110 121 144 Use patterns to show how to find the incorrect mass. What is the correct mass? b) Draw points on a graph using Shandi’s results in the table above. c) How could you use your graph to show which value is incorrect? a) 20. A taxi company in Edmonton charges $3 for the first 210 m plus 20¢ for each additional 210 m. a) What is the cost for a trip of length 2100 m? of length 4.41 km? b) Make a table of values showing the relationship between the distance in metres and the cost in cents. Use integers only. c) Graph the ordered pairs. d) Is it a linear relation? Why? 21. Describe the pattern in each table of values. Then, graph each set of ordered pairs. 3 5 8 Volume (cm3) 2 4 Shandi determined the mass of five pieces of a type of metal. The table shows her results. The relationship is linear. Shandi made one error in finding the masses. a) b) 22. a) t 0 1 2 3 4 d 2 3 4 5 6 x 8 7 6 2 y 4 3 2 -2 Complete the table using the relationship “multiply x by 2 and then add 3 to get y.” x -2 -1 0 1 2 3 11 y b) Is it a linear relation? Explain. 9.3 Linear Relationships • MHR 09_ML8_Chapter09_7th.indd 359 359 4/9/08 4:19:39 PM

