Measurement Uncertainty Evaluation of the Null Detector Method
advertisement

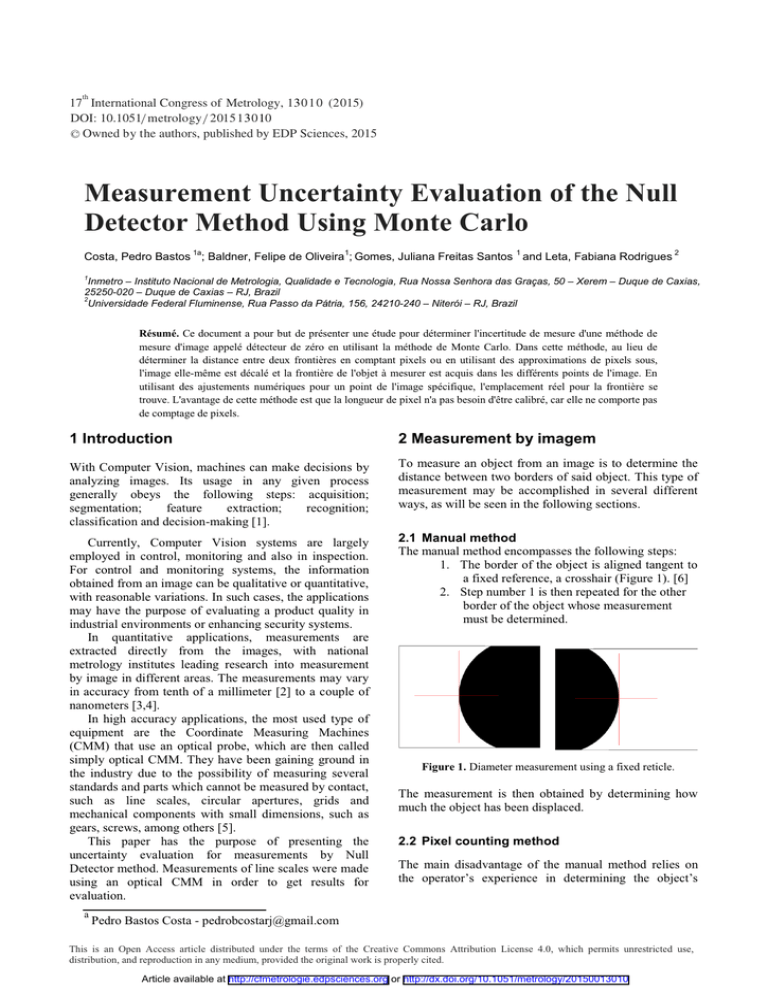
th 17 International Congress of Metrology, 13 010 (2015) DOI: 10.1051/ m etrolo gy / 2015 1 3 0 10 C Owned by the authors, published by EDP Sciences, 2015 Measurement Uncertainty Evaluation of the Null Detector Method Using Monte Carlo 1a 1 1 Costa, Pedro Bastos ; Baldner, Felipe de Oliveira ; Gomes, Juliana Freitas Santos and Leta, Fabiana Rodrigues 2 Inmetro – Instituto Nacional de Metrologia, Qualidade e Tecnologia, Rua Nossa Senhora das Graças, 50 – Xerem – Duque de Caxias, 25250-020 – Duque de Caxias – RJ, Brazil 2 Universidade Federal Fluminense, Rua Passo da Pátria, 156, 24210-240 – Niterói – RJ, Brazil 1 Résumé. Ce document a pour but de présenter une étude pour déterminer l'incertitude de mesure d'une méthode de mesure d'image appelé détecteur de zéro en utilisant la méthode de Monte Carlo. Dans cette méthode, au lieu de déterminer la distance entre deux frontières en comptant pixels ou en utilisant des approximations de pixels sous, l'image elle-même est décalé et la frontière de l'objet à mesurer est acquis dans les différents points de l'image. En utilisant des ajustements numériques pour un point de l'image spécifique, l'emplacement réel pour la frontière se trouve. L'avantage de cette méthode est que la longueur de pixel n'a pas besoin d'être calibré, car elle ne comporte pas de comptage de pixels. 1 Introduction 2 Measurement by imagem With Computer Vision, machines can make decisions by analyzing images. Its usage in any given process generally obeys the following steps: acquisition; segmentation; feature extraction; recognition; classification and decision-making [1]. To measure an object from an image is to determine the distance between two borders of said object. This type of measurement may be accomplished in several different ways, as will be seen in the following sections. Currently, Computer Vision systems are largely employed in control, monitoring and also in inspection. For control and monitoring systems, the information obtained from an image can be qualitative or quantitative, with reasonable variations. In such cases, the applications may have the purpose of evaluating a product quality in industrial environments or enhancing security systems. In quantitative applications, measurements are extracted directly from the images, with national metrology institutes leading research into measurement by image in different areas. The measurements may vary in accuracy from tenth of a millimeter [2] to a couple of nanometers [3,4]. In high accuracy applications, the most used type of equipment are the Coordinate Measuring Machines (CMM) that use an optical probe, which are then called simply optical CMM. They have been gaining ground in the industry due to the possibility of measuring several standards and parts which cannot be measured by contact, such as line scales, circular apertures, grids and mechanical components with small dimensions, such as gears, screws, among others [5]. This paper has the purpose of presenting the uncertainty evaluation for measurements by Null Detector method. Measurements of line scales were made using an optical CMM in order to get results for evaluation. 2.1 Manual method The manual method encompasses the following steps: 1. The border of the object is aligned tangent to a fixed reference, a crosshair (Figure 1). [6] 2. Step number 1 is then repeated for the other border of the object whose measurement must be determined. a Figure 1. Diameter measurement using a fixed reticle. The measurement is then obtained by determining how much the object has been displaced. 2.2 Pixel counting method The main disadvantage of the manual method relies on the operator’s experience in determining the object’s Pedro Bastos Costa - pedrobcostarj@gmail.com This is an Open Access article distributed under the terms of the Creative Commons Attribution License 4.0, which permits unrestricted use, distribution, and reproduction in any medium, provided the original work is properly cited. Article available at http://cfmetrologie.edpsciences.org or http://dx.doi.org/10.1051/metrology/20150013010 Web of Conferences border which is then directly tied to the accuracy and the error due to the crosshair thickness. One way of eliminating the operator’s influence is by using the pixel counting method [7]. In this method the measurement does not use a fixed reference in the image, but instead how much the object was displaced plus the difference between the two positions in the image, as can be seen in the example of figure 2. The following steps are required in order to extract a measurement using the pixel counting method: 1. From the first image the position for the border of the image and the displacement are acquired. 2. The same procedure of step number 1 is repeated in the object’s other extremity. Laser Beam splitter Reference mirror Microscope Standard Displacement table Figure 3. Measurement system for line scales. In this system, the standard is placed on the displacement table and aligned in relation to an interferometric laser. The displacements of the table are measured by the laser and are seen, at the same time, through the microscope with a magnification of up to 400x. The images seen through the microscope are then acquired by a CCD camera. 3.2 Null detector Figure 2. Diameter measurement by counting pixels. The result of the measurement is given by adding to the displacement of the object in the two images (the Pixel Distance in figure 2) the distance between the object’s border in both images. This distance has the pixel as a measurement unit, and, to obtain it in the proper length unit the pixel must be calibrated. This is achieved by using a dimensional standard with known uncertainties, which will, thus, add another contribution for the object’s uncertainty of measurement. 3. Null Detector Method 3.1 Measurement system The objective of the measurements with this new methodology is to eliminate the uncertainty contribution regarding the pixel calibration as means of decreasing the measurement uncertainty as a whole for image measurement. This methodology is an enhancement of the manual measurement previously described in item 2. However, instead of having an operator manually position the extremities of the object on the crosshair show in the screen (which was the main disadvantage of said method), these extremities are numerically projected to a fixed point. For each of the object’s extremities, a sequence of images is acquired, each in a different position. From every image the information for displacement and border position are extracted. With this set of data, two graphs can be ploted for pixel x displacement, one for each extremity. The sequence of points must be then fitted linearly, generating equations of the type L a p b where position L, in millimeters, is to be determined for a fixed value of p, in pixel, that will be used on the two fitted equations that were calculated. The difference between the values of L for the equations of both extremities is the measurement result. 3.3 Measurement procedure The Null Detector was used with the measurement system for line scales of the Dimensional Metrology Laboratory (Lamed) of the Brazil’s National Institute of Metrology, Quality and Technology (Inmetro). The system comprises a coordinate measuring machine with an optical measurement system, as shown in figure 3. A procedure has been designed to evaluate the Null Detector’s performance by measuring a line scale of 5 mm with 1 mm as the smallest division. For this procedure, the distances between the points of 1 mm, 2 mm, 3 mm, 4 mm e 5 mm will be measured with reference to the 0 mm point. As stated in item 3.2, measurement with the Null Detector consists of acquiring a sequence of images. Five images were used for this test and, consequentially, five 13010-p.2 17th International Congress of Metrology values for the displacement. When measuring the line scale, this procedure is repeated for each of the distances being measured. Thus, for every image both the pixel value for the center of the mark of the scale and the displacement value for the interferometric laser are extracted. During measurement, five images are acquired and five displacement values are registered for the point of 0 mm. This is then repeated for all the other points, from 1 mm to 5 mm. Equations for the displacement in function of the pixel value are interpolated for every measured point using the least squares method, obtaining: L0 a0 b0 p L a b p 1 1 1 L5 a5 b5 p 4. Uncertainty evaluation In short what was presented in the previous section, one measure distance on the scale is calculated by the difference between two lengths, as shown below. (2) L Li L0 Where Li is any scale mark and L0 the reference mark. Each L is obtained from the equation 1. To determine the uncertainty an investigation was carried out into all sources of influence in the calculation of the values of L, as indicated in table 2. Table 2. Parameters used for the simulation. (1) Where the indexes 0, 1, ..., 5 refer to the traces of the scale and the value of p is the point in the image chosen sit gat all the lengths are projected to it. The graph below, in figure 4, shows the five curves obtained in one measurement cycle. Figure 4. Graph of the points with the equations found for all the measured points. Li PDF Parameters of PDF Distance measured by the laser Normal = measured position s = 15 nm Edge detection Uniform +a = edge on the image + 0,5 -a = edge on the image - 0,5 Normal = measured position s = 15 nm Edge detection Uniform +a = edge on the image + 0,5 -a = edge on the image - 0,5 Repeatability Normal = measurement average s = measurement repeatability (table 1) L0 Distance measured by the laser The Monte Carlo simulation was performed for each of the points measured on the scale, changing only the repeatability of their respective values, shown in Table 1. The results were obtained after the simulation performed with 2.105 iterations. The graph below is the histogram of simulation for the 1 mm length. The histograms for 2 mm, 3 mm, 4 mm and 5 mm were similar to this graph. Lastly, the lengths for the line scale are calculated by the difference between each calculated value of L and the value of L0, which is used as a reference. For measurements made following this procedure the following results were obtained: Table 1. Measurement results obtained for the 5 mm line scale calibration. Points 1 mm 2 mm 3 mm 4 mm 5 mm Standard Deviation (nm) 119 242 219 279 323 Repeatability (nm) 7 6 8 5 7 Figure 5. Histogram for 1 mm simulation. The uncertainties were obtained determining the standard deviation for the resulting distributions of the simulations. To obtain a probability of coverage of 95% 13010-p.3 Web of Conferences Câmera as a Line Detector.” Applied Optics, 33, p 36003603, 1994. to final uncertainty was estimated two standard deviations, as shown in Table 3. Table 3. Results and uncertainty of measurements. 5. Points Deviation (nm) 1 mm 2 mm 3 mm 4 mm 5 mm 119 242 219 279 323 Standard Deviation (nm) 29 28 30 29 29 8. P. B. Costa, W. S. Barros. “Calibração de Escalas Graduadas no Inmetro” 1º Congresso Internacional de Metrologia Mecânica, I CIMMEC, Rio de Janeiro, Brasil, 2008. 9. Instituto Nacional de Metrologia, Normalização e Qualidade Industrial, Coordenação Geral de Acreditação. Orientação Sobre Validação de Métodos Analíticos, DOQCGCRE 008, 2011. U95% (nm) 58 56 59 57 57 Conclusions The aim of this study was to evaluate the uncertainty of the Null-detector method through a numerical analysis by the Monte Carlo method. Based on presented results, it can be concluded that the implementation of the simulation method has been quite satisfactory, since the histogram of lengths of the resulting simulation showed frequencies of occurrence, in all cases, which is the typical behavior of normal distributions probability. The evaluation of uncertainty by Monte Carlo method is still gaining ground in many applications in different areas of metrology, and proved an extremely effective solution in cases where an alternative to the traditional method of ISO GUM is wanted, or even when a comparison between GUM and Monte Carlo results is needed with the purpose of validation. REFERENCES 1. A. Conci, E. Azevedo. F. R. Leta. “Computação Gráfica: Teoria e Prática.” Volume 2. Rio de Janeiro: Elsevier, 2008. 405p. 2. G. M. Vieira, F. R. Leta, P B. Costa, S. L. Braga, D. Gobin. “Computer Vision Analysis of a Melting Interface Problem with Natural Convection.” 4th International Conference on Advanced Computational Engineering and Experimenting, ACE-X, Paris, França, 2010. 3. P. B. Costa, A. Marques, F. O. Baldner, F. R. Leta. “Line scale measurement using image registration.” International Journal of Metrology and Quality Engineering, vol.04, PP 121-125, 2013. 4. J.S. Beers, W. B. Penzes. “The NIST Scale Interferometer.” Journal of Research of the National Institute of Standards and Technology, vol. 104, 1999. 5. G. Rodger. “Measurement Good Practice Guide: Dimensional Measurement Using Vision Systems.” National Physical Laboratory, Middlesex, UK, 2001. 6. P. B. Costa, W. S. Barros, R. S. Oliveira, M. S. Dutra. “Development of a software for the line scales calibration system in INMETRO.” The 19th Congress of Mechanical Engineering, Brasília, 2007. 7. A. Lassila, E. Ikonen, K. Riski. “Interferometer for Calibration of Graduated Line Scales with a Moving Ccd 13010-p.4


