Early Estimate of Motor Vehicle Traffic Fatalities in 2015
advertisement

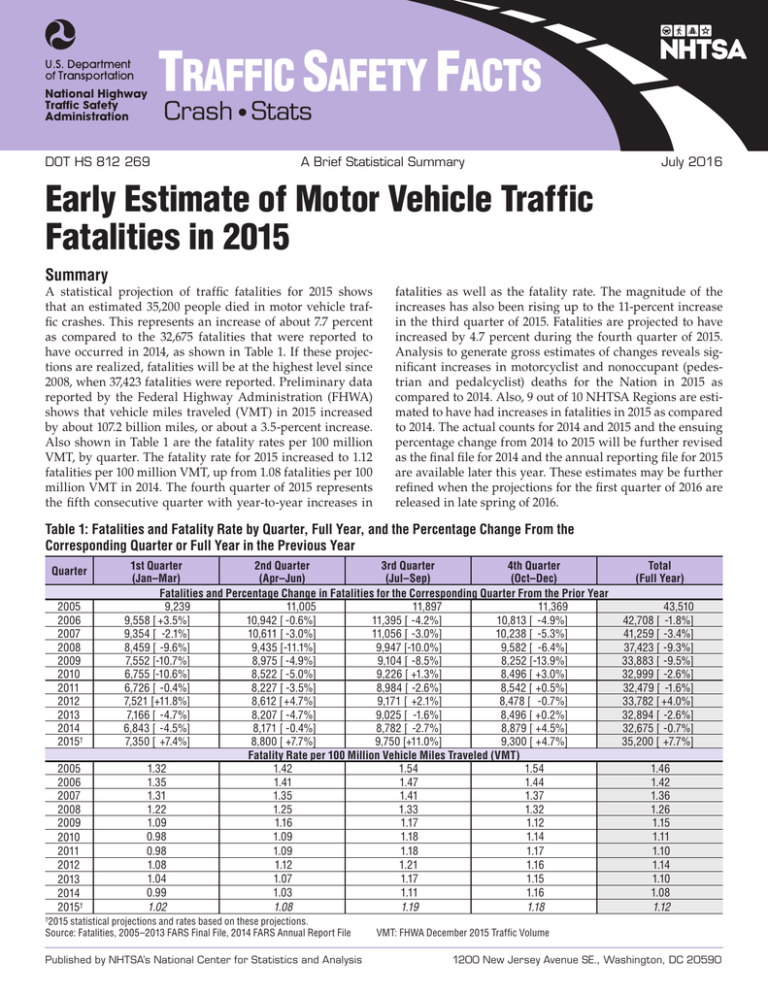
TRAFFIC SAFETY FACTS Crash • Stats DOT HS 812 269 A Brief Statistical Summary July 2016 Early Estimate of Motor Vehicle Traffic Fatalities in 2015 Summary A statistical projection of traffic fatalities for 2015 shows that an estimated 35,200 people died in motor vehicle traffic crashes. This represents an increase of about 7.7 percent as compared to the 32,675 fatalities that were reported to have occurred in 2014, as shown in Table 1. If these projections are realized, fatalities will be at the highest level since 2008, when 37,423 fatalities were reported. Preliminary data reported by the Federal Highway Administration (FHWA) shows that vehicle miles traveled (VMT) in 2015 increased by about 107.2 billion miles, or about a 3.5-percent increase. Also shown in Table 1 are the fatality rates per 100 million VMT, by quarter. The fatality rate for 2015 increased to 1.12 fatalities per 100 million VMT, up from 1.08 fatalities per 100 million VMT in 2014. The fourth quarter of 2015 represents the fifth consecutive quarter with year-to-year increases in fatalities as well as the fatality rate. The magnitude of the increases has also been rising up to the 11-percent increase in the third quarter of 2015. Fatalities are projected to have increased by 4.7 percent during the fourth quarter of 2015. Analysis to generate gross estimates of changes reveals significant increases in motorcyclist and nonoccupant (pedestrian and pedalcyclist) deaths for the Nation in 2015 as compared to 2014. Also, 9 out of 10 NHTSA Regions are estimated to have had increases in fatalities in 2015 as compared to 2014. The actual counts for 2014 and 2015 and the ensuing percentage change from 2014 to 2015 will be further revised as the final file for 2014 and the annual reporting file for 2015 are available later this year. These estimates may be further refined when the projections for the first quarter of 2016 are released in late spring of 2016. Table 1: Fatalities and Fatality Rate by Quarter, Full Year, and the Percentage Change From the Corresponding Quarter or Full Year in the Previous Year Quarter 2005 2006 2007 2008 2009 2010 2011 2012 2013 2014 2015† 2005 2006 2007 2008 2009 2010 2011 2012 2013 2014 2015† 1st Quarter 2nd Quarter 3rd Quarter 4th Quarter (Jan–Mar) (Apr–Jun) (Jul–Sep) (Oct–Dec) Fatalities and Percentage Change in Fatalities for the Corresponding Quarter From the Prior Year 9,239 11,005 11,897 11,369 9,558 [ +3.5%] 10,942 [ -0.6%] 11,395 [ -4.2%] 10,813 [ -4.9%] 9,354 [ -2.1%] 10,611 [ -3.0%] 11,056 [ -3.0%] 10,238 [ -5.3%] 8,459 [ -9.6%] 9,435 [-11.1%] 9,947 [-10.0%] 9,582 [ -6.4%] 7,552 [-10.7%] 8,975 [ -4.9%] 9,104 [ -8.5%] 8,252 [-13.9%] 6,755 [-10.6%] 8,522 [ -5.0%] 9,226 [ +1.3%] 8,496 [ +3.0%] 6,726 [ -0.4%] 8,227 [ -3.5%] 8,984 [ -2.6%] 8,542 [ +0.5%] 7,521 [+11.8%] 8,612 [ +4.7%] 9,171 [ +2.1%] 8,478 [ -0.7%] 7,166 [ -4.7%] 8,207 [ -4.7%] 9,025 [ -1.6%] 8,496 [ +0.2%] 6,843 [ -4.5%] 8,171 [ -0.4%] 8,782 [ -2.7%] 8,879 [ +4.5%] 7,350 [ +7.4%] 8,800 [ +7.7%] 9,750 [+11.0%] 9,300 [ +4.7%] Fatality Rate per 100 Million Vehicle Miles Traveled (VMT) 1.32 1.42 1.54 1.54 1.35 1.41 1.47 1.44 1.31 1.35 1.41 1.37 1.22 1.25 1.33 1.32 1.09 1.16 1.17 1.12 0.98 1.09 1.18 1.14 0.98 1.09 1.18 1.17 1.08 1.12 1.21 1.16 1.04 1.07 1.17 1.15 0.99 1.03 1.11 1.16 1.02 1.08 1.19 1.18 2015 statistical projections and rates based on these projections. Source: Fatalities, 2005–2013 FARS Final File, 2014 FARS Annual Report File Total (Full Year) 43,510 42,708 [ -1.8%] 41,259 [ -3.4%] 37,423 [ -9.3%] 33,883 [ -9.5%] 32,999 [ -2.6%] 32,479 [ -1.6%] 33,782 [ +4.0%] 32,894 [ -2.6%] 32,675 [ -0.7%] 35,200 [ +7.7%] 1.46 1.42 1.36 1.26 1.15 1.11 1.10 1.14 1.10 1.08 1.12 † Published by NHTSA’s National Center for Statistics and Analysis VMT: FHWA December 2015 Traffic Volume 1200 New Jersey Avenue SE., Washington, DC 20590 2 Figure 1 shows the historical trend of the percentage change every quarter from the same quarter in the previous year, going back to 1976. NHTSA has fatality data going back to 1975, and the years during the early 1980s and 1990s are the only two other periods with such significant consecutive quarters with declines as compared to the corresponding quarters of the previous years. Both periods had 11 consecutive quarters of declines. 20% 15% 10% 5% 0% -5% -10% -15% -20% 1981 Q2 to 1983 Q4 (11 Quarters) 2006 Q2 to 2010 Q2 (17 Quarters) 1990 Q4 to 1993 Q2 (11 Quarters) 1976 1977 1978 1979 1980 1981 1982 1983 1984 1985 1986 1987 1988 1989 1990 1991 1992 1993 1994 1995 1996 1997 1998 1999 2000 2001 2002 2003 2004 2005 2006 2007 2008 2009 2010 2011 2012 2013 2014 2015 % Changes Figure 1: Percentage Change in Fatalities in Every Quarter as Compared to the Fatalities in the Same Quarter During the Previous Year Breakdown of Estimated Changes The significant changes projected to have occurred during 2015 have warranted a look into changes by categories (pedestrians, occupants, etc.) of interest. While such analysis is unprecedented and NHTSA’s FastFARS does not collect such detailed information, cases currently coded for 2015 into NHTSA’s Fatality Analysis Reporting System (FARS) were used to construct estimated changes along these categories. Also NHTSA’s methodology for estimating overall fatalities allows for the examination of regional changes. Published by NHTSA’s National Center for Statistics and Analysis Regional Differences As discussed in a methodology Research Note, Statistical Methodology to Make Early Estimates of Motor Vehicle Traffic ­ ­Fatalities (Chen, Subramanian, Choi, & Liu, 2010), the statistical procedures employed in these projections were generated for each NHTSA administrative Region and were collated to create the national estimate. This allows for the comparison of regional estimates in 2015 with the reported 2014 counts, as depicted by the estimated percentage changes in Figure 2. Nine of 10 NHTSA Regions experienced increases during 2015 as compared to reported totals during 2014. The estimated regional year-to-year percentage changes shown in Figure 2 are subject to change as fatality counts for 2014 and 2015 are ­finalized. 1200 New Jersey Avenue SE., Washington, DC 20590 3 Figure 2: Percentage Change in Estimated Fatalities in 2015 From Reported 2014 Fatality Counts, by NHTSA Region AK WA +20% Region 10 MT OR MN ND ID WY NV UT +9% Region 5 +7% Region 8 OK NM HI TX MI PA IL -1% Region 6 OH IN +8% Region 7 WV KY DC VA NC MO TN AR AL MS NJ MD IA NE KS AZ WI SD CO +6% Region 9 CA +10% ME Region 1 NH +4% MA Region RI 2 CT NY VT GA DE +9% Region 3 SC +14% Region 4 LA FL Estimates based on the data coded thus far into FARS for 2015 reveals that most of the Nation saw significant increases in motorcyclist (9% increase), pedestrian (10% increase) and pedalcyclist fatalities (13% increase). Fatalities to drivers and passengers also increased (6% and 7%, respectively). Fatalities in crashes involving young drivers (15 to 20 years old) increased 10 percent. Fatalities in crashes involving large trucks increased by 4 percent. Also, fatalities among occupants of passenger vehicles that rolled over increased by about 5 percent. These estimates are created by inflating current 2015 cases coded into FARS to regional totals presented in this note for the overall fatalities. Essentially, ratio inflation factors by NHTSA Region and month are estimated and applied to the current 2015 cases coded thus far into FARS. Figures 3 and 4 depict the estimated changes from 2014 to 2015 using this approach for certain key categories of interest. These estimates are subject to change as more information gets coded into these cases as well as when more cases are entered into FARS. These estimates will also change subject to the revision of the overall fatality estimate for 2015. Published by NHTSA’s National Center for Statistics and Analysis Percentage Change from 2014 The input data streams used in the forecasting model are not reported by sub-categories of interest such as pedestrian and motorcyclist fatalities. Therefore, a statistical modelbased approach is not feasible to generate estimates by sub-­ categories. However, cases currently coded for 2015 into FARS provide a basis for constructing gross estimates of fatalities by sub-categories. Figure 3: Percentage Change in Fatalities From 2014 to 2015, by Person Type 14% 13% 12% 10% 9% 8% 6% 4% 10% 7% 6% 2% 0% Driver Passenger Motorcyclist Pedestrian Pedalcyclist Figure 4: Percentage Change in Fatalities From 2014 to 2015, by Crash Type (not mutually exclusive) Percentage Change from 2014 Estimated Changes by Sub-Categories 14% 12% 10% 10% 8% 6% 4% 2% 0% 5% 4% Involving a Large Truck Involving a Young Driver In PV Rollovers 1200 New Jersey Avenue SE., Washington, DC 20590 4 Discussion NHTSA is continuing to gather data on crash fatalities for 2014 and 2015 using information from police crash reports and other sources. It is too soon to speculate on the contributing factors or potential implications of any changes in deaths on our roadways. The final data for 2014 as well as the annual file for 2015 will be available later in 2016, which usually results in the revision of fatality totals and the ensuing rates and percentage changes. In the last few years, since recording a significant increase of 11.8 percent during the first quarter of 2012, the magnitude of the increases steadily declined during each subsequent quarter. Fatalities are reported to have increased by about 4.7 percent in the second quarter and by about 2.1 percent in the third quarter of 2012. Subsequently, beginning with the fourth quarter of 2012, fatalities have declined 7 out of 8 quarters (2013 Q4 was a marginal 0.2% increase) until the 4.5 percent increase estimated for the fourth quarter of 2014. Fatalities have increased 5 consecutive quarters beginning with the fourth quarter of 2014. The magnitude of the increases also increased each quarter until the 11 percent increase in the third quarter of 2015. Fatalities are projected to have increased by 4.7 percent during the fourth quarter of 2015. The fatality rates per 100 million in 2014 VMT, when compared to the rates for the corresponding quarters in 2013, are lower for the first 3 quarters of 2014 and higher for the fourth quarter of 2014. The fatality rates for all 4 quarters of 2015 are significantly higher than those for the corresponding quarters in 2014. Data The data used in this analysis comes from several sources: FARS, FastFARS (FF), and Monthly Fatality Counts (MFC); and from FHWA’s VMT estimates. FARS is a census of fatal traffic crashes in the 50 States, the District of Columbia, and Puerto Rico. To be included in FARS, a crash must involve a motor vehicle traveling on a trafficway and must result in the death of at least one person (occupant of a vehicle or a nonoccupant) within 30 days of the crash. FARS final files from January 2003 to December 2013 and FARS Annual Report file in 2014 are used. The FF program is designed as an Early Fatality Notification System to capture fatality counts from States more rapidly and in real-time. It aims to provide nearreal-time notification of fatality counts from all jurisdictions reporting to FARS. The MFC data provides monthly fatality counts by State through sources that are independent from the FastFARS or FARS systems. MFCs from January 2003 up to February 2016 are used. MFCs are reported mid-month for all prior months of the year. In order to estimate the traffic fatality counts for each month of 2015, time series cross-section regression was applied to analyze the data with both cross-sectional values (by NHTSA Region) and time series (by month), to model the relationship among FARS, MFC, and FF, the details of which are available in a companion Research Note. The methodology used to generate the estimates for 2015 is the same as the one used by NHTSA to project the increase in the fatalities for the whole of 2014, Early Estimates of Motor Vehicle Traffic Fatalities in 2014 (NCSA, 2014) as well as projections of fatalities for the first nine months of 2014, Early Estimates of Motor Vehicle Traffic Fatalities for the First Nine Months of 2015 (NCSA, 2016). References Chen, C.-L., Subramanian, R., Choi, E. H., & Liu, C. (2010, November). Statistical methodology to make early estimates of motor vehicle traffic fatalities (Traffic Safety Facts Research Note. Report No. DOT HS 811 123). Washington, DC: National Highway Traffic Safety Administration. Available at www-nrd.nhtsa.dot.gov/Pubs/811123.pdf National Center for Statistics and Analysis. (2015, June). Early estimate of motor vehicle traffic fatalities for 2014 (Crash•Stats Brief Statistical Summary. Report No. DOT HS 812 160). Washington, DC: National Highway Traffic Safety Administration. Available at www-nrd.nhtsa.dot.gov/ Pubs/812160.pdf National Center for Statistics and Analysis. (2016, January). Early estimate of motor vehicle traffic fatalities for the first nine months (Jan–Sep) of 2015. (Crash•Stats Brief Statistical Summary. Report No. DOT HS 812 240). Washington, DC: National Highway Traffic Safety Administration. Available at www-nrd.nhtsa.dot.gov/Pubs/812240.pdf Suggested APA Format Citation for this document: National Center for Statistics and Analysis. (2016, July). Early estimate of motor vehicle traffic fatalities for 2015 (Crash•Stats Brief ­Statistical Summary. Report No. DOT HS 812 269). Washington, DC: National Highway Traffic Safety Administration. For questions regarding the information presented in this document, please contact NCSAWEB@dot.gov. Internet users may access this Crash•Stats and other general information on traffic safety at www-nrd.nhtsa.dot.gov/CATS/ index.aspx. Published by NHTSA’s National Center for Statistics and Analysis 1200 New Jersey Avenue SE., Washington, DC 20590 12398-063016-v7


