Experiment 25: Location of the Fermi Level by
advertisement

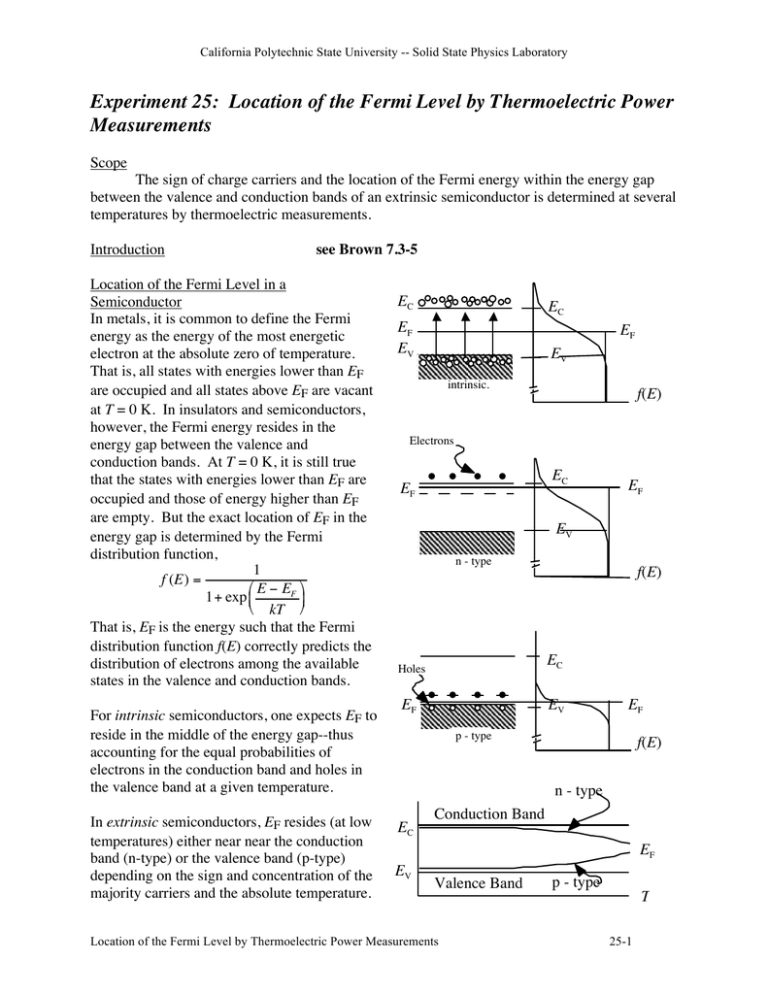
California Polytechnic State University -- Solid State Physics Laboratory Experiment 25: Location of the Fermi Level by Thermoelectric Power Measurements Scope The sign of charge carriers and the location of the Fermi energy within the energy gap between the valence and conduction bands of an extrinsic semiconductor is determined at several temperatures by thermoelectric measurements. Introduction see Brown 7.3-5 Location of the Fermi Level in a Semiconductor In metals, it is common to define the Fermi energy as the energy of the most energetic electron at the absolute zero of temperature. That is, all states with energies lower than EF are occupied and all states above EF are vacant at T = 0 K. In insulators and semiconductors, however, the Fermi energy resides in the energy gap between the valence and conduction bands. At T = 0 K, it is still true that the states with energies lower than EF are occupied and those of energy higher than EF are empty. But the exact location of EF in the energy gap is determined by the Fermi distribution function, 1 f (E) = " E ! EF % 1+ exp $ ' # kT & That is, EF is the energy such that the Fermi distribution function f(E) correctly predicts the distribution of electrons among the available states in the valence and conduction bands. For intrinsic semiconductors, one expects EF to reside in the middle of the energy gap--thus accounting for the equal probabilities of electrons in the conduction band and holes in the valence band at a given temperature. In extrinsic semiconductors, EF resides (at low temperatures) either near near the conduction band (n-type) or the valence band (p-type) depending on the sign and concentration of the majority carriers and the absolute temperature. EC EC EF EV EF EV intrinsic. f(E) Electrons EC EF EF EV n - type f(E) Holes EC EF EV EF p - type f(E) n - type EC Conduction Band EF EV Valence Band Location of the Fermi Level by Thermoelectric Power Measurements p - type T 25-1 California Polytechnic State University -- Solid State Physics Laboratory As the temperature increases, the Fermi energy shifts toward the center of the energy gap. This behavior is due to the increasing number of intrinsic electron-hole pairs that are thermally generated at elevated temperatures. (The limiting case, of course, is when the temperature is sufficiently high that the intrinsic carrier concentration far exceeds the dopant concentration thus causing the semiconductor to behave more like an intrinsic semiconductor. The Fermi level would then reside near the center of the energy gap.) Any experiment that is sensitive to the location of the Fermi level in the energy gap should exhibit the shift of EF when performed at different temperatures. Thermoelectric Power If two points in a conducting material are maintained at two different temperatures T1 and T2 , there will be a thermoelectric voltage ΔV between those two points (this is called the Seebeck effect). The polarity of the thermally generated emf depends on the sign of the majority carriers and whether T1 or T2 is the higher temperature. The negative of the temperature gradient of the voltage is defined as the "thermoelectric power" Q. That is, Q =-dV/dT. For small values of (T2 - T1) the thermoelectric power can be approximated by $ #V ' $ #V ' dV Q=" = "& ) = "& ) % #T ( % T2 " T1 ( dT The above definition makes Q positive for p-type and negative for n-type semiconductors. The thermoelectric power of a semiconductor can also be related to the Fermi level location in the energy gap (see Azároff and Brophy, pp. 233-236). ! p - type semiconductor: TQpe = (EF - Ev) + 2kT n - type semiconductor: -TQne = (Ec - EF) + 2kT where EF is the Fermi level, Ev is the energy of the top of the valence band, Ec is the energy of the bottom of the conduction band, e is the electronic charge, k is Boltzmann's constant, and T is the average absolute (Kelvin) temperature of the sample. Thus the measurement of the thermoelectric power Q of an extrinsic semiconductor can determine the location of the Fermi level relative to either the valence band in p-type or the conduction band in n-type. Procedure The specimen is a small bar of germanium similar to that used in the Hall effect experiment. It is either n-type or p-type. You should be able to make that determination from your experimental results. The ends of the specimen can be maintained at different temperatures for short periods of time by means of the thermally insulated reservoirs. The temperature of each end of the specimen is determined by using thermocouples connected to a digital thermometer and the thermoelectric voltage ΔV of the germanium sample can be measured with a voltmeter. 25-2 Location of the Fermi Level by Thermoelectric Power Measurements California Polytechnic State University -- Solid State Physics Laboratory Data should be taken for at least ten different average sample temperatures. Be sure to allow enough time for the temperature gradient to be established. You might use warm water baths, cold-water baths, and dry ice-alcohol mixtures. In order for the thermoelectric power to be approximated by ΔV/ΔT, the temperature difference between the two ends of the specimen should not exceed about 10 oC. Keep track of which side of the sample is at which temperature and the sign of the measured voltage. CAUTION - The specimen is fragile. It is protected by screens as guards, but could still be easily damaged. Be careful when introducing and pouring off mixtures which contain ice or dry-ice. Stir very carefully, keeping the stirring rod away from the region of the specimen. Report • Determine the majority carrier type for the extrinsic semiconductor. Justify your determination by explaining the polarity of ΔV, based on transport arguments, of the majority carriers given a "polarity" of (T2 - T1). • Determine the location of the Fermi Level for each value of average sample temperature. Plot your results as a function of T and discuss the results. • Compare your graph to Fig. 6 on page 208 of the text by Azároff and Brophy (see next page). Estimate the approximate dopant concentration in your germanium specimen. References Azároff and Brophy, Electronic Processes in Materials, pp. 203-208. Digital Thermometer voltmeter !V Tc1 Tc2 T1 T2 Ge Specimen Location of the Fermi Level by Thermoelectric Power Measurements 25-3 California Polytechnic State University -- Solid State Physics Laboratory 25-4 Location of the Fermi Level by Thermoelectric Power Measurements


