Section 3: Transformations of Exponential and Logarithmic Functions
advertisement

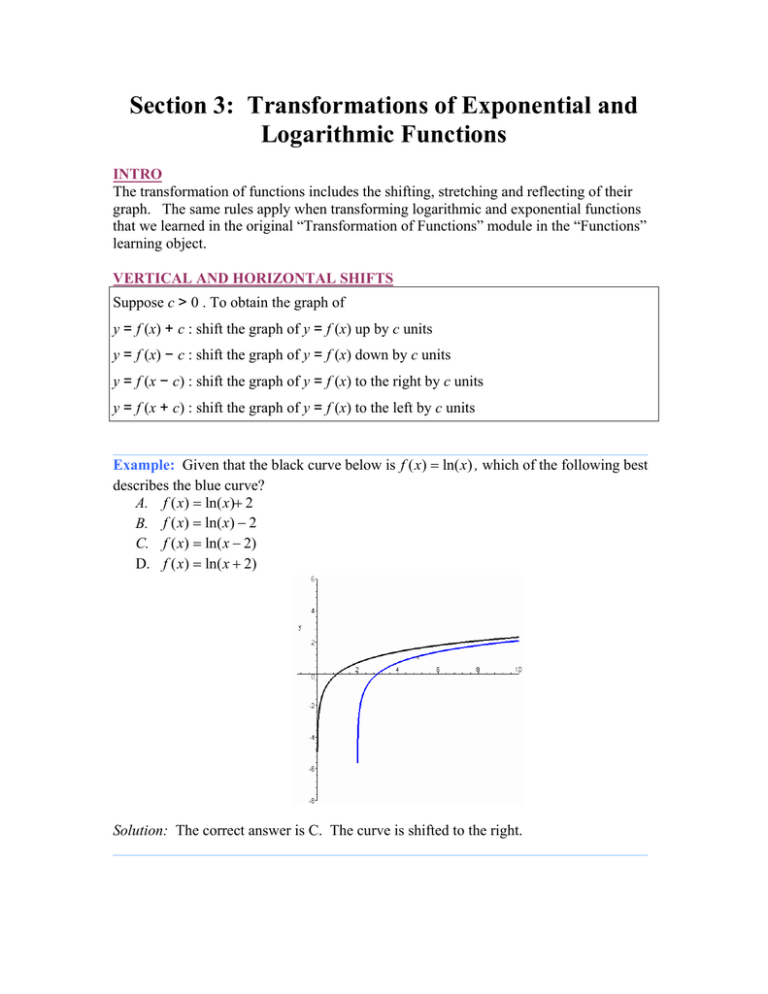
Section 3: Transformations of Exponential and Logarithmic Functions INTRO The transformation of functions includes the shifting, stretching and reflecting of their graph. The same rules apply when transforming logarithmic and exponential functions that we learned in the original “Transformation of Functions” module in the “Functions” learning object. VERTICAL AND HORIZONTAL SHIFTS Suppose c > 0 . To obtain the graph of y = f (x) + c : shift the graph of y = f (x) up by c units y = f (x) − c : shift the graph of y = f (x) down by c units y = f (x − c) : shift the graph of y = f (x) to the right by c units y = f (x + c) : shift the graph of y = f (x) to the left by c units _______________________________________________________________________ Example: Given that the black curve below is f ( x) = ln( x) , which of the following best describes the blue curve? A. f ( x) = ln( x)+ 2 B. f ( x) = ln( x) − 2 C. f ( x) = ln( x − 2) D. f ( x) = ln( x + 2) Solution: The correct answer is C. The curve is shifted to the right. _______________________________________________________________________ VERTICAL AND HORIZONTAL STRETCHES/COMPRESSIONS Suppose c > 1. To obtain the graph of y = cf (x) : stretch the graph of y = f (x) vertically by a factor of c 1 y = f ( x) : compress the graph of y = f (x) vertically by a factor of c c y = f (cx) : compress the graph of y = f (x) horizontally by a factor of c ⎛ x⎞ y = f ⎜ ⎟ : stretch the graph of y = f ( x) horizontally by a factor of c ⎝c⎠ _______________________________________________________________________ Example: Given that black represents the curve f ( x) = e x , match the blue and green curves with their respective algebraic representations. A. f ( x) = e 5 x x B. f ( x) = e 5 Solution: The blue curve matches function A. It is compressed horizontally by a factor of 5. The green curve matches function B. It is stretched horizontally by a factor of 5. _______________________________________________________________________ REFLECTIONS To obtain the graph of y = − f ( x) : reflect the graph of y = f ( x ) about the x-axis y = f (− x) : reflect the graph of y = f ( x ) about the y-axis _______________________________________________________________________ Example: Sketch f ( x) = ln( x) and its reflections about the x-axis and y-axis. Write the equation for each. Solution: The black curve is the original, f ( x) = ln( x) . The blue curve is the reflection about the y-axis, g ( x) = ln(− x) . The red curve is the reflection about the x-axis, h( x) = − ln( x) . _______________________________________________________________________ For a detailed explanation of some more difficult examples, check out the mini-clips!


