A P P L I C AT I O N N O T E
Signal Amplification Strategies for Rapid
and Sensitive High Content Analysis
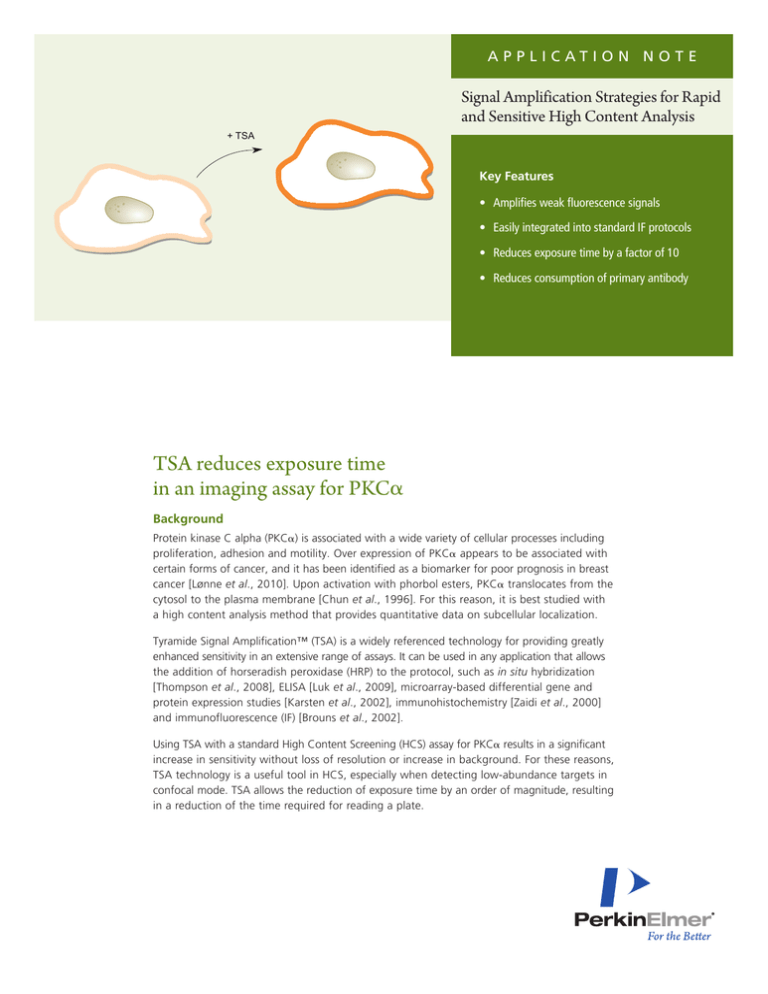
+ TSA
Key Features
• Amplifies weak fluorescence signals
• Easily integrated into standard IF protocols
• Reduces exposure time by a factor of 10
• Reduces consumption of primary antibody
TSA reduces exposure time
in an imaging assay for PKCa
Background
Protein kinase C alpha (PKCa) is associated with a wide variety of cellular processes including
proliferation, adhesion and motility. Over expression of PKCa appears to be associated with
certain forms of cancer, and it has been identified as a biomarker for poor prognosis in breast
cancer [Lønne et al., 2010]. Upon activation with phorbol esters, PKCa translocates from the
cytosol to the plasma membrane [Chun et al., 1996]. For this reason, it is best studied with
a high content analysis method that provides quantitative data on subcellular localization.
Tyramide Signal Amplification™ (TSA) is a widely referenced technology for providing greatly
enhanced sensitivity in an extensive range of assays. It can be used in any application that allows
the addition of horseradish peroxidase (HRP) to the protocol, such as in situ hybridization
[Thompson et al., 2008], ELISA [Luk et al., 2009], microarray-based differential gene and
protein expression studies [Karsten et al., 2002], immunohistochemistry [Zaidi et al., 2000]
and immunofluorescence (IF) [Brouns et al., 2002].
Using TSA with a standard High Content Screening (HCS) assay for PKCa results in a significant
increase in sensitivity without loss of resolution or increase in background. For these reasons,
TSA technology is a useful tool in HCS, especially when detecting low-abundance targets in
confocal mode. TSA allows the reduction of exposure time by an order of magnitude, resulting
in a reduction of the time required for reading a plate.
Application
We have used the TSA Plus Cyanine 3 Kit (PerkinElmer) for
signal enhancement in the PKCa activation assay (Cellomics®
PKCa Activation HCS Reagent Kit, Thermo Scientific®) which
is a standard IF protocol. HeLa cells were seeded into a 384
CellCarrier™ microtiter plate (PerkinElmer) at a density of
10,000 cells per well and cultured overnight. PKCa was
activated by treatment with phorbol 12-myristate-13-acetate
(PMA). After 10 minutes of compound incubation at various
concentrations, cells were fixed using 3.7 % formaldehyde.
The cells were permeabilized with 0.2 % Triton X-100 and
2 µg/ml
secondary AB
(DyLight 549)
1 µg/ml
secondary AB
(DyLight 549)
labeled with anti-PKCa primary monoclonal antibody followed
by an HRP labeled secondary antibody (PerkinElmer). Finally,
cells were incubated in Cyanine 3 TSA working solution. Both
antibodies were used at various concentrations to identify
the optimal staining conditions.
To reference against a non-amplified signal, cells were labeled
with DyLight 549 coupled secondary antibody. Nuclei were
stained using 10 µM Hoechst 33342 dye solution. The plate
was imaged on the Operetta® High Content Screening system
in confocal fluorescence mode using the 20X high NA objective.
0.5 µg/ml
secondary AB
(DyLight 549)
A (- TSA)
2 µg/ml
secondary AB
(HRP)
1 µg/ml
secondary AB
(HRP)
0.5 µg/ml
secondary AB
(HRP)
B (+ TSA)
no primary AB
0.2X primary
AB stock
1X primary
AB stock
Figure 1. TSA signal amplification of PKCα imaging. Fluorescence images (PKCα channel) of non-stimulated cells labeled with various concentrations of primary /
secondary antibodies either with or without the amplification reagent. A| Without TSA. B| 50X diluted TSA amplification reagent stock. The rows show various
concentrations of primary PKCα antibody and the columns show different dilutions of secondary antibody, DyLight 549 labeled (A) or HRP labeled (B). The Operetta
images were taken in confocal mode using the 20X high NA objective and an exposure time of 800 ms.
2
Five fields per well were imaged and analyzed (Figures 1-3).
clearly detectable both with and without amplification.
PKCa is localized in the cytoplasm and then translocates to the
plasma membrane upon compound stimulation. We showed
that TSA amplification did not influence the localization of
PKCa signal (Figure 2), but reduced the exposure time by a
factor of ten. Furthermore, TSA amplification allowed for 5X
less primary antibody to be used compared to the standard
protocol. Translocation of PKCa upon PMA treatment was
For quantification of PKCa activation, we used the texture
image analysis module "SER Ridge" in the Harmony® image
analysis software to identify typical membrane shaped “ridges”
of 3 pixel width (Figure 3). The calculated signal, based on the
frequency and intensity of identified ridges, represented PKCa
association with cell membranes. The assay showed the same
dynamic range with and without TSA amplification, however,
the TSA results had a slightly increased signal to background ratio.
Unstimulated
A
Stimulation with 800 mM PMA
B
Standard detection,
8.0 s exposure
1X primary AB stock
2 µg/ml secondary AB (DyLight 549)
C
D
TSA amplified detection,
0.8 s exposure
0.2X primary AB stock
1 µg/ml secondary AB (HRP)
0.02X TSA stock
Figure 2. Comparison of PKCα signal without and with TSA amplification. Images show false color overlays of nuclei (Hoechst, blue) and PKCα (yellow). A, B |
Non-amplified PKCα signal obtained using an exposure time of 8 s. C, D | TSA amplified PKCα signal obtained using an exposure time of 0.8 s using the 20X high NA
objective in confocal mode. B, D | Cells were stimulated with 800 mM PMA. A, C | Cells were not stimulated.
SER normalized Ridge (3px)
1.6x10 -3
1.4x10 -3
Conclusions
1.2x10
We present here the integration of the Tyramide Signal
Amplification (TSA) kit into a typical antibody-based high
content imaging assay, activation of PKCa. The TSA enhanced
signal of PKCa resulted in a significant increase in sensitivity,
with an increased signal to background ratio and without loss
of resolution. No adaptation of the image analysis strategy was
necessary and cytosolic and plasma membrane signal detection
allowed for reliable quantification of PKCa activation.
Fluorescence signal amplification using TSA is a valuable tool
for high content assays that suffer from weak fluorescence
signals and require long exposure times.
-3
1.0x10 -3
8.0x10 -4
6.0x10 -4
4.0x10 -4
2.0x10 -4
0
no TSA
TSA
unstimulated cells (no PMA)
stimulated cells (800mM PMA)
Figure 3. Quantification of signal amplified PKCα activation in HeLa
cells stimulated with PMA. The texture analysis module in the
Harmony software was used to identify typical membrane shaped
“ridges” of 3 pixel width.
3
References
Lønne GK, Cornmark L, Zahirovic IO, Landberg G, Jirström K,
Larsson C (2010): PKCa expression is a marker for breast cancer
aggressiveness. Molecular Cancer, 9(76), doi:10.1186/14764598-9-76
Zaidi AU, Enomoto H, Milbrandt J, Roth KA (2000): Dual
Fluorescent In Situ Hybridization and Immunohistochemical
Detection with Tyramide Signal Amplification. Journal of
Histochemistry & Cytochemistry, 48, 1369-1376
Chun J, Ha M, Jacobson BS (1996): Differential Translocation
of Protein Kinase C e during HeLa Cell Adhesion to a Gelatin
Substratum. Journal of Biological Chemistry, 271, 13008-13012,
doi:10.1074/jbc.271.22.13008
Brouns I, Van Nassauw L, Van Genechten J, Majewski M,
Scheuermann DW, Timmermans J, Adriaensen D (2002): Triple
Immunofluorescence Staining with Antibodies Raised in the
Same Species to Study the Complex Innervation Pattern of
Intrapulmonary Chemoreceptors. Journal of Histochemistry
& Cytochemistry, 50, 575-582
Thompson CL, Pathak SD, Jeromin A, Ng LL, MacPherson
CR, Mortrud MT, Cusick A, Riley ZL, Sunkin SM, Bernard A,
Puchalski RB, Gage FH, Jones AR, Bajic VB, Hawrylycz MJ, Lein
ES (2008): Genomic Anatomy of the Hippocampus. Neuron,
60(6), 1010-1021
Luk C, Giovannoni G, Williams DR, Lees AJ, de Silva R (2009):
Development of a sensitive ELISA for quantification of threeand four-repeat tau isoforms in tauopathies. Journal of
Neuroscience Methods, 180(1), 34-42, doi: 10.1016/j.
jneumeth.2009.02.015
Karsten SL, Van Deerlin VMD, Sabatti C, Gill LH, Geschwind DH
(2002): An evaluation of tyramide signal amplification and
archived fixed and frozen tissue in microarray gene expression
analysis. Nucleic Acids Research, 30(2), e4
Authors
Stefan Letzsch
Michael Campisano
PerkinElmer
Cellular Technologies Germany GmbH
Cellular Imaging & Analysis
Hamburg, DE
For further details on High Content Screening please visit www.perkinelmer.com/imaging
For further details on TSA please visit www.perkinelmer.com/tsa
PerkinElmer, Inc.
940 Winter Street
Waltham, MA 02451 USA
P: (800) 762-4000 or
(+1) 203-925-4602
www.perkinelmer.com
For a complete listing of our global offices, visit www.perkinelmer.com/ContactUs
Copyright ©2010, PerkinElmer, Inc. All rights reserved. PerkinElmer® is a registered trademark of PerkinElmer, Inc. Chromobody is a registered trademark of Prof. Ulrich Rothbauer et al. All other trademarks are the property of their
respective owners.
009251_01
Printed in USA
Jul. 2010


