Velocity acceleration lab
advertisement

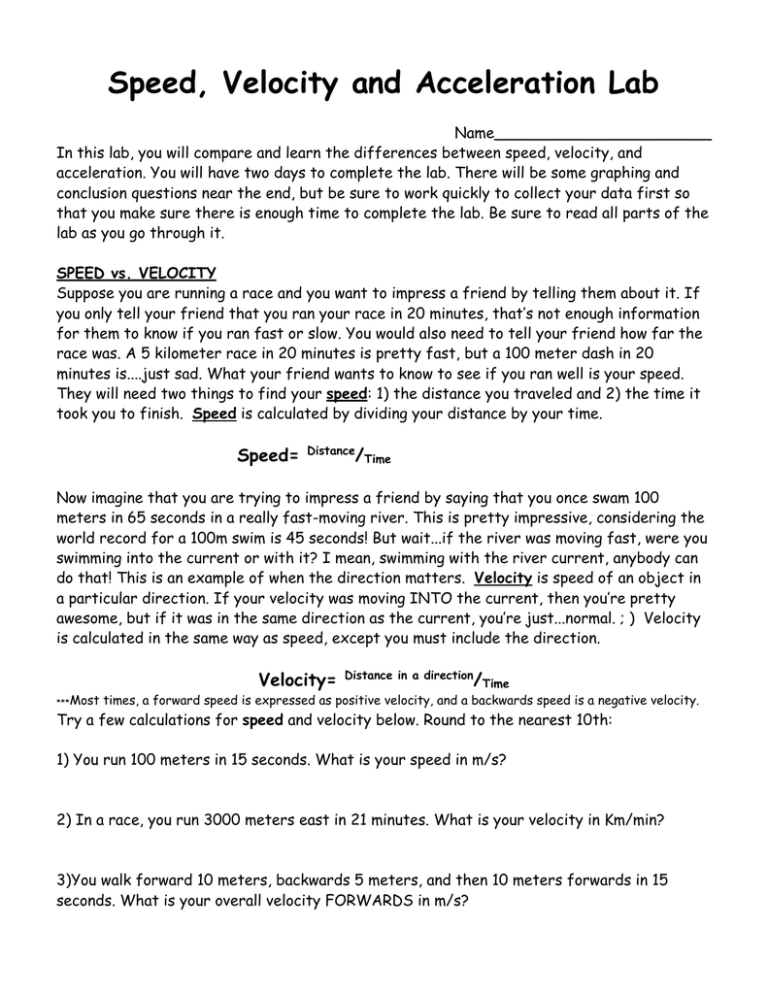
Speed, Velocity and Acceleration Lab Name_______________________ In this lab, you will compare and learn the differences between speed, velocity, and acceleration. You will have two days to complete the lab. There will be some graphing and conclusion questions near the end, but be sure to work quickly to collect your data first so that you make sure there is enough time to complete the lab. Be sure to read all parts of the lab as you go through it. SPEED vs. VELOCITY Suppose you are running a race and you want to impress a friend by telling them about it. If you only tell your friend that you ran your race in 20 minutes, that’s not enough information for them to know if you ran fast or slow. You would also need to tell your friend how far the race was. A 5 kilometer race in 20 minutes is pretty fast, but a 100 meter dash in 20 minutes is....just sad. What your friend wants to know to see if you ran well is your speed. They will need two things to find your speed: 1) the distance you traveled and 2) the time it took you to finish. Speed is calculated by dividing your distance by your time. Speed= Distance /Time Now imagine that you are trying to impress a friend by saying that you once swam 100 meters in 65 seconds in a really fast-moving river. This is pretty impressive, considering the world record for a 100m swim is 45 seconds! But wait...if the river was moving fast, were you swimming into the current or with it? I mean, swimming with the river current, anybody can do that! This is an example of when the direction matters. Velocity is speed of an object in a particular direction. If your velocity was moving INTO the current, then you’re pretty awesome, but if it was in the same direction as the current, you’re just...normal. ; ) Velocity is calculated in the same way as speed, except you must include the direction. ***Most Velocity= Distance in a direction /Time times, a forward speed is expressed as positive velocity, and a backwards speed is a negative velocity. Try a few calculations for speed and velocity below. Round to the nearest 10th: 1) You run 100 meters in 15 seconds. What is your speed in m/s? 2) In a race, you run 3000 meters east in 21 minutes. What is your velocity in Km/min? 3)You walk forward 10 meters, backwards 5 meters, and then 10 meters forwards in 15 seconds. What is your overall velocity FORWARDS in m/s? ACCELERATION Many times in sports, people can run fast, but it may take them a while for them to get to their top speed. If you are chasing after a soccer ball, but you are not very quick, you may not get to it first. The rate that you can change your speed/velocity is called the acceleration. Just like velocity, acceleration must have a direction. Speeding up is a positive acceleration, slowing down is a negative acceleration. Average Acceleration= (Final velocity-Starting velocity) /Time Many times, we can see this with car advertisements that say, “This car can go from 0-60 in 4.2 seconds!” The Final velocity is 60, the starting velocity is 0, and the time is 4.2 seconds. 1) What would the average acceleration be for a car at a stoplight that speeds up to 20 m/s in 10 seconds (in m/s2 )? 2) Imagine that a car traveling at 100 m/s must slam on the brakes to avoid hitting a racoon. If it takes 4 seconds for the car to slow down to a stop, what is its acceleration (in m/s2 )? VELOCITY MINI-LAB Question:How does the height of a ramp affect the velocity of a car rolling down it? Write your own if-then hypothesis below: Investigation: 1. Gather one ramp, one car, one timer, and five books. 2. Measure the length of your ramp in cm to the nearest 10th of a centimeter and write it here._________cm 3. Set up a ramp using one book to elevate your ramp. Measure the height of the ramp and record it here. _________cm 4. Set the car at the top of your ramp. 5. Start the timer and release your car at the same time. Stop the timer once the car touches the table. 6. Record the time in Table 1. 7. Use the Distance of the ramp and the time to find the velocity of the car (in cm/s). 8. Repeat steps 3-7 with 2 books, 3 books, 4 books, and 5 books. 9. Graph the Height of the ramp against the velocity and make your conclusion. Table 1 Ramp Height (cm) Time (s) 1. Independent Variable________________ VELOCITY (cm/s) Dependent Variable_________________ ACCELERATION MINI-LAB Question: What is the acceleration of a car that travels down a ramp and eventually stops? Observation: Acceleration of most solid falling objects is around 9.8 m/s2 Write your if-then hypothesis here: Investigation: 1.Set up a ramp using 5 books. Measure out another meter from the end of the ramp, and mark out every 50 cm using a piece of tape on the ground. Measure the total distance and record it here. _______cm 2.Have three people with three stopwatches and one person be in charge of releasing the toy car. 3. Assign one timer to stop at the end of the ramp, one timer to stop at 50 cm, and one timer to stop at 100 cm. 4.On a count of three, have all three timers begin and the car release from the top of the ramp. 5.Record the times that it took the car to reach the end of the ramp, 50 cm, and 100 cm. 6. Repeat steps 4 and 5 two more times and record in Table 1. Calculate the average times and record in table 2. 7.Calculate the velocity of the car at the beginning of the ramp (HINT: it’s sitting still), at the end of the ramp, 50 cm, and 100 cm. 8.Graph the velocities of the car at each of the 4 parts of the ramp system in a line graph. Table 1 Distance Trial 1 Trial 2 Trial 3 Average time End of ramp 50 cm 100 cm Table 2 Location Top of Ramp End of Ramp 50 cm 100 cm Actual Distance (cm) 0 cm Time 0s Velocity= Distance/time 0 m/s Questions/Conclusion 1. Independent Variable________________ Dependent Variable__________________ 2. Calculate the average acceleration between the top of the ramp and the bottom of the ramp. Show your work. 3. Calculate the average acceleration between the bottom of the ramp and the end of the 100 cm mark. Show your work. 4. What are some things that may have caused bias in your experiment? Explain at least 1 example well. REVIEW: Match up graphs 1-4 with the correct description of the motion of the object for section one, and then use the section two graph to complete questions 5-7. Graph 5 1. ______ Object is staying in the same place. 2. ______ Object is moving at a constant velocity 3. ______ Object is accelerating. 4. ______ Object is moving at a constant velocity and then stops/stays in the same place. 5. ______ Which section(s) of the graph show(s) an object accelerating? a) A b) B c) C d) A and C 6. ______ Which section(s) of the graph show(s) an object moving at a constant velocity? a) A b) B c) C d) A and C 5. ______ Which section(s) of the graph show(s) an object accelerating at a rate of about 2 m/s2? a) A b) B c) C d) A and C


