Rules for Making Bode Plots
advertisement
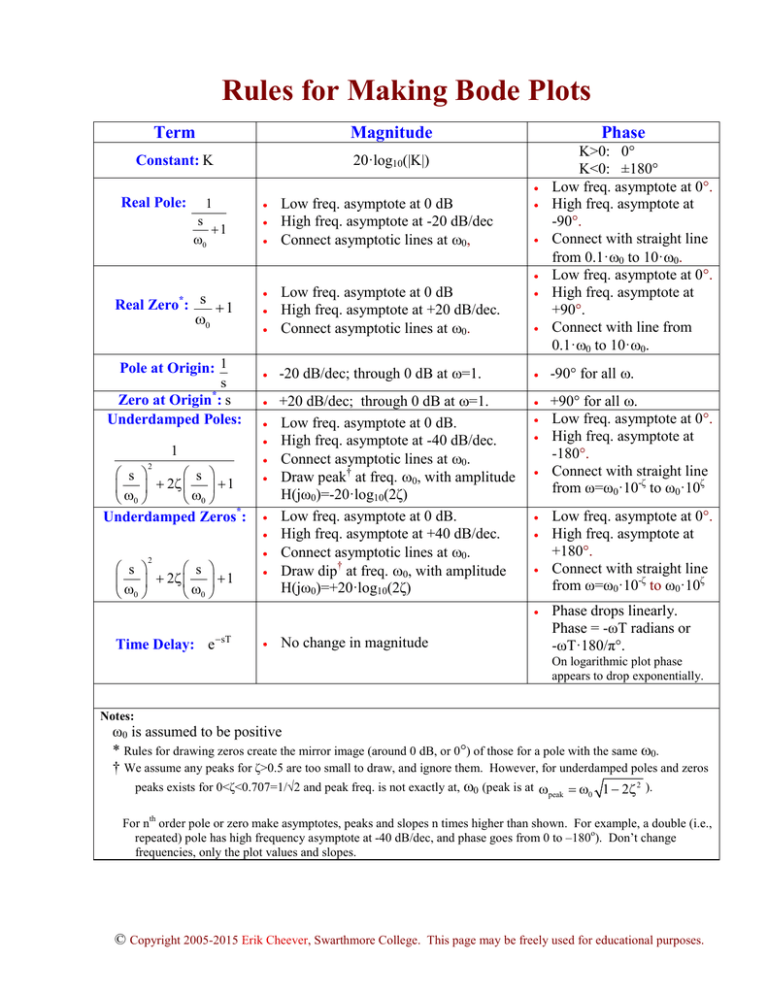
Rules for Making Bode Plots
Term
Magnitude
Constant: K
20·log10(|K|)
Phase
•
Real Pole:
1
•
s
+1
ω0
•
•
Low freq. asymptote at 0 dB
High freq. asymptote at -20 dB/dec
Connect asymptotic lines at ω0,
•
•
•
Real Zero*: s + 1
ω0
Pole at Origin: 1
s
Zero at Origin*: s
Underdamped Poles:
1
2
s
s
+ 2ζ + 1
ω0
ω0
Underdamped Zeros*:
•
•
Low freq. asymptote at 0 dB
High freq. asymptote at +20 dB/dec.
Connect asymptotic lines at ω0.
•
-20 dB/dec; through 0 dB at ω=1.
•
-90° for all ω.
•
+20 dB/dec; through 0 dB at ω=1.
Low freq. asymptote at 0 dB.
High freq. asymptote at -40 dB/dec.
Connect asymptotic lines at ω0.
Draw peak† at freq. ω0, with amplitude
H(jω0)=-20·log10(2ζ)
Low freq. asymptote at 0 dB.
High freq. asymptote at +40 dB/dec.
Connect asymptotic lines at ω0.
Draw dip† at freq. ω0, with amplitude
H(jω0)=+20·log10(2ζ)
•
+90° for all ω.
Low freq. asymptote at 0°.
High freq. asymptote at
-180°.
Connect with straight line
from ω=ω0·10-ζ to ω0·10ζ
•
•
•
•
•
•
•
•
2
s
s
+ 2ζ + 1
ω0
ω0
•
•
•
•
•
•
•
•
•
•
Time Delay: e−sT
K>0: 0°
K<0: ±180°
Low freq. asymptote at 0°.
High freq. asymptote at
-90°.
Connect with straight line
from 0.1·ω0 to 10·ω0.
Low freq. asymptote at 0°.
High freq. asymptote at
+90°.
Connect with line from
0.1·ω0 to 10·ω0.
•
No change in magnitude
Low freq. asymptote at 0°.
High freq. asymptote at
+180°.
Connect with straight line
from ω=ω0·10-ζ to ω0·10ζ
Phase drops linearly.
Phase = -ωT radians or
-ωT·180/π°.
On logarithmic plot phase
appears to drop exponentially.
Notes:
ω0 is assumed to be positive
* Rules for drawing zeros create the mirror image (around 0 dB, or 0°) of those for a pole with the same ω0.
† We assume any peaks for ζ>0.5 are too small to draw, and ignore them. However, for underdamped poles and zeros
peaks exists for 0<ζ<0.707=1/√2 and peak freq. is not exactly at, ω0 (peak is at ωpeak =ω0 1 − 2ζ 2 ).
For nth order pole or zero make asymptotes, peaks and slopes n times higher than shown. For example, a double (i.e.,
repeated) pole has high frequency asymptote at -40 dB/dec, and phase goes from 0 to –180o). Don’t change
frequencies, only the plot values and slopes.
© Copyright 2005-2015 Erik Cheever, Swarthmore College. This page may be freely used for educational purposes.
Quick Reference for Making Bode Plots
If starting with a transfer function of the form (some of the coefficients bi, ai may be zero).
s n + + b1s + b0
H(s) = C m
s + + a1s + a 0
Factor polynomial into real factors and complex conjugate pairs (p can be positive, negative, or zero; p is zero if a0 and b0 are both non-zero).
2
2
(s + ωz1 )(s + ωz2 ) (s 2 + 2ζ z1ω0z1s + ω0z1
)(s 2 + 2ζ z2ω0z2s + ω0z2
)
H(s)= C ⋅ s
2
2
2
2
(s + ωp1 )(s + ωp2 ) (s + 2ζ p1ω0p1s + ω0p1 )(s + 2ζ p2ω0p2s + ω0p2 )
p
Put polynomial into standard form for Bode Plots.
2
2
s s
s
s
s
s
+ 1
+ 1
+ 2ζ z1
+ 1
+ 2ζ z2
+ 1
ω
ω
ω
ω
ω
ω
z1 z2
0z1
0z1 0z2
0z2
2
2
ωz1ωz2 ω0z1
ω0z2
p
H(s) C
⋅s
2
2
2
2
ωp1ωp2 ω0p1ω0p2
s s
s
s
s
s
+ 1
+ 2ζ p2
+ 1
+ 1
+ 1
+ 2ζ p1
ω ω
ω
ω
ω
ω
0p1 0p2
0p2
p1 p2
0p1
2
2
s s
s
s
s s
+ 1
+
+ 2ζ z1
+ 1
+ 2ζ z2
+ 1
ωz1 ωz2 ω0z1
ω0z1 ω0z2
ω0z2
= K ⋅ sp
2
2
s s
s
s
s
s
+
2
ζ
+
1
+
2
ζ
+ 1
+ 1
+ 1
p1
p2
ω ω
ω
ω
ω
ω
0p1 0p2
0p2
p1 p2
0p1
Take the terms (constant, real poles and zeros, origin poles and zeros, complex poles and zeros) one by one and plot magnitude and phase
according to rules on previous page. Add up resulting plots.
© Copyright 2005-2015 Erik Cheever, Swarthmore College. This page may be freely used for educational purposes.
Matlab Tools for Bode Plots
>> n=[1 11 10];
>> d=[1 10 10000 0];
>> sys=tf(n,d)
Transfer function:
s^2 + 11 s + 10
---------------------s^3 + 10 s^2 + 10000 s
%A numerator polynomial (arbitrary)
%Denominator polynomial (arbitrary)
>> damp(d)
Eigenvalue
0.00e+000
-5.00e+000 + 9.99e+001i
-5.00e+000 - 9.99e+001i
%Find roots of den. If complex, show zeta, wn.
Damping
Freq. (rad/s)
-1.00e+000
0.00e+000
5.00e-002
1.00e+002
5.00e-002
1.00e+002
>> damp(n)
Eigenvalue
-1.00e+000
-1.00e+001
%Repeat for numerator
Freq. (rad/s)
1.00e+000
1.00e+001
>>
>>
>>
>>
>>
Damping
1.00e+000
1.00e+000
%Use Matlab to find frequency response (hard way).
w=logspace(-2,4);
%omega goes from 0.01 to 10000;
fr=freqresp(sys,w);
subplot(211); semilogx(w,20*log10(abs(fr(:)))); title('Mag response, dB')
subplot(212); semilogx(w,angle(fr(:))*180/pi);
title('Phase resp, degrees')
>> %Let Matlab do all of the work
>> bode(sys)
>> %Find Freq Resp at one freq.
%Hard way
>> fr=polyval(n,j*10)./polyval(d,j*10)
fr =
0.0011 + 0.0010i
>> %Find Freq Resp at one freq.
>> fr=freqresp(sys,10)
fr =
0.0011 + 0.0009i
%Easy way
>> abs(fr)
ans =
0.0014
>> angle(fr)*180/pi
ans =
38.7107
%Convert to degrees
>> %You can even find impulse and step response from transfer function.
>> step(sys)
>> impulse(sys)
© Copyright 2005-2015 Erik Cheever, Swarthmore College. This page may be freely used for educational purposes.
>> [n,d]=tfdata(sys,'v')
n =
0
1
11
10
d =
1
10
>> [z,p,k]=zpkdata(sys,'v')
z =
-10
-1
p =
0
-5.0000 +99.8749i
-5.0000 -99.8749i
k =
1
%Get numerator and denominator.
10000
0
%Get poles and zeros
>> %BodePlotGui - Matlab program shows individual terms of Bode Plot.
>> %
http://lpsa.swarthmore.edu/NatSci/Bode/BodePlotGui.html
>>
>> BodePlotGui(sys)
Code at:
© Copyright 2005-2015 Erik Cheever, Swarthmore College. This page may be freely used for educational purposes.
