Model Definition: This example covers on how to use VISIT software
advertisement
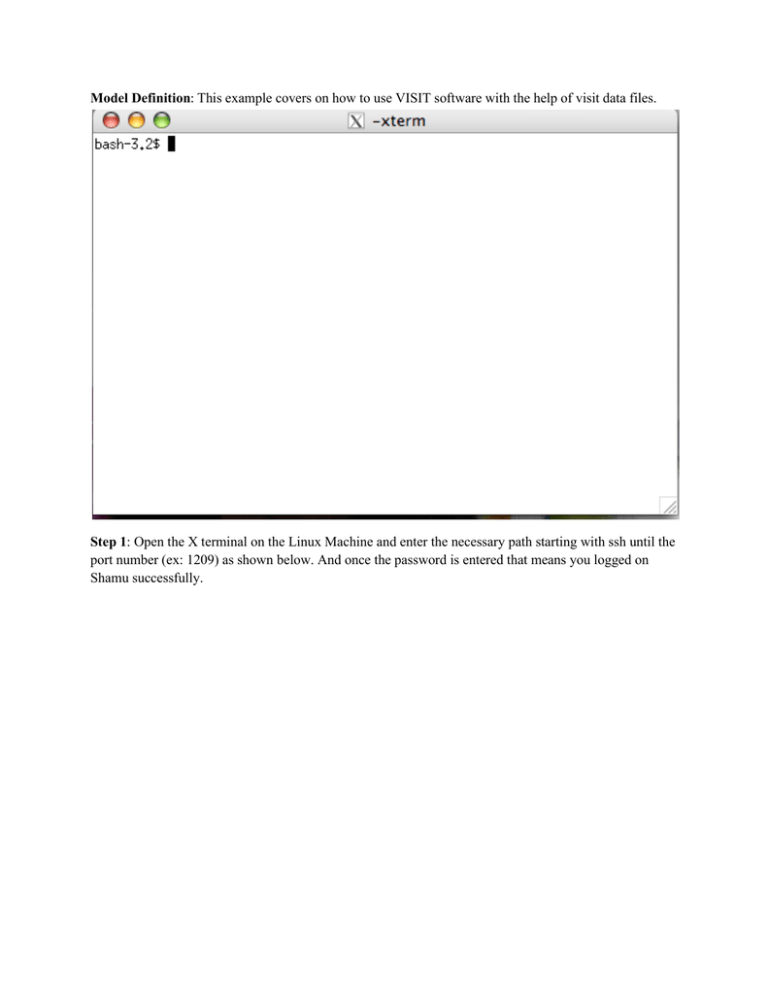
Model Definition: This example covers on how to use VISIT software with the help of visit data files. Step 1: Open the X terminal on the Linux Machine and enter the necessary path starting with ssh until the port number (ex: 1209) as shown below. And once the password is entered that means you logged on Shamu successfully. Step2: Inorder to find the modules available on Shamu Server we can use the command ‘module avail ‘which gives you all the modules available on the server. Step3: Once you decide on which software you to work load the respective module and then enter the software name, it takes you to that respective page. Visit page opens like the picture shown below. Step 4: Likewise in other software’s we have many options in the VISIT software also.Inorder to have good visualization it is always better to have the extensions supported by the Visit. Step5: Go to File option->Select File which will give a window as shown below. Step 6:The files which we can see are the Visit_data _files downloaded fron the visit website .We can select the files that are neccesary and all files that are selected shows in Selected Files List. Step7:Again select the file in Selected file list and it will be highligthed when selectedand then press OK Step 8:Then your file is selected Open the file then the option Open changes to Reopen ,This Re-open is to always have the file activated. Step 9: Once the file gets activated Plot option is also activated, based on the model you can choose different options .In this example Pseudocolor->mesh quality->mesh1->area Step10 Step10:Once we are done with suitable options then it highlights in Green color as shown below.The your Dram option is activated and Press Draw and this will give picture based on your options chosen. Step 11: Any number of files can be chosen at a time with different other options, we need to just select the file which the plots are required. You can also import 3 Dimensional file as shown below Step 12: For either 2Dimensional or 3Dimensional file it is the same steps for importing and visualizing and plotting. It also shows the variation with the help of different colors and their values ranging from Maximum to Minimum which gives a clear understanding. Step13: Go to File->Open File-> in the window opened below, you can an option Open file as type, which gives you all the extensions that visit allow you to import.
